
SLIDE 1
Market update
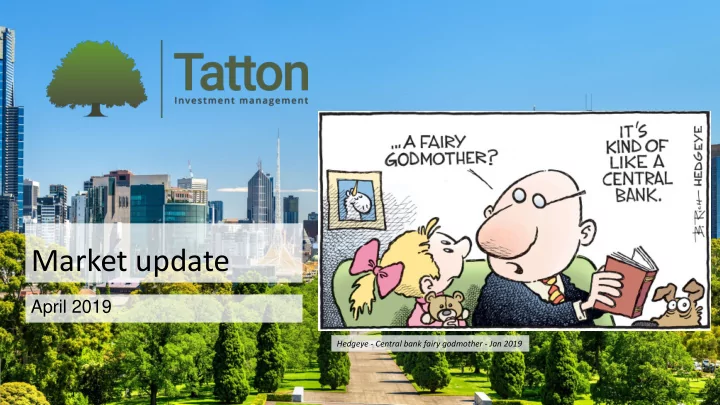
April 2019
Hedgeye - Central bank fairy godmother - Jan 2019
Market update April 2019 Hedgeye - Central bank fairy godmother - - - PowerPoint PPT Presentation
Market update April 2019 Hedgeye - Central bank fairy godmother - Jan 2019 Today 1. 2018 What happened 2. Portfolio activity and returns overview 3. 2019 current state 4. Outlook www.tattoninvestments.com | Tel: 02071902959 | 17 St
April 2019
Hedgeye - Central bank fairy godmother - Jan 2019
2 www.tattoninvestments.com | Tel: 02071902959 | 17 St Swithin's Lane, London EC4N 8AL | @TattonIM
3 www.tattoninvestments.com | Tel: 02071902959 | 125 Old Broad Street, London, EC2N 1AR | @TattonIM
www.tattoninvestments.com | Tel: 02071902959 | 125 Old Broad Street, London, EC2N 1AR | @TattonIM 4
2018 stock markets: A last quarter to forget
Source: Morningstar, 31 March 2019. Note: Past Performance is no guarantee for future returns. Index returns do not take into account the cost of advice and the cost of investing
‘98 Russia Crisis ’00-03 Dot-com Bubble+Iraq Crash ’08-09 GFC & Eurozone Crisis + recovery 2017 2018 ‘87 20% Crash
5
Note: Past Performance is no guarantee for future
purposes only Returns shown do not take into account the cost of advice and the cost of platform administration
Source: Morningstar / Tatton IM, 31 March 2019
6
2018 - a year to forget; Q1 2019: Best since 1987
To 31 March 2019 Note: Past Performance is no guarantee for future returns. Index returns do not take into account the cost of advice and the cost of investing
7 www.tattoninvestments.com | Tel: 02071902959 | 125 Old Broad Street, London, EC2N 1AR | @TattonIM
Lothar Mentel
CEO & Chief Investment Officer For professional use only 31 January 2018
8
Source: Morningstar / Tatton IM
1. Big picture 2. Portfolio activity 3. Portfolio returns 2017 4. Outlook 5. Business News
Source: Financial Times, 30 Jan 2018
9
Trump’s timely tax reform surprises
Luck or skill? The debate will carry on
‘Nowcast’ GDP indicators - raised back to ‘old normal’ hopes
Source: Goldman Sachs Economics Research, 21 Nov 2017
Normalising rather than falling off a cliff?
11
Stock market levels not as high as some thought
30 June 2018; BES, MSCI, Standard & Poor’s, Thomson Reuters Datastream, J.P. Morgan Asset Management. Valuations refer to 12- month forward price-to-earnings ratios for Europe ex-UK, US, Japan, UK and emerging markets. Valuation and earnings charts use MSCI indices for all regions/countries, except for the US, which is the S&P 500.
12 www.tattoninvestments.com | Tel: 02071902959 | 125 Old Broad Street, London, EC2N 1AR | @TattonIM
Source: Financial Times, 11 Aug 2017
13
North Korea – war of words only (so far)
Turning into a frozen conflict?
Lothar Mentel
CEO & Chief Investment Officer For professional use only 12 April 2018
14
Source: Hedgeye, 5 April 2018
…and worryingly quickly drove up bond yields
US inflation made predictable re-appearance
15
Source: Hedgeye, 20 Feb 2018
..and so market volatility returned
Credit default fears returned equity volatility which triggered volatility shorting product collapses
Stock markets corrected and left exuberance behind
17
Source: Bloomberg, 17 August 2018
Return to previous trend channel?
…after an uncomfortable January rally
Lothar Mentel
Chief Investment Officer & CEO For professional use only 20 August 2018
18
Bull and bear both had their moments in the sun during H1 2018; Source: Hedgeye, 27 April 2018
US stocks hit new highs in late summer
19
Source: Bloomberg, 1 October 2018
Fundamentally justified?
20
Certainly supported in terms of earnings
Source: IBES, S&P, Thompson Reuters Datastream, JPM Asset Management, NTM is next 12 months
“Lift-off” “Escape velocity” “Second tech boom” ?
finally returns
Global ex-US did not follow
21
Source: Bloomberg, 1 October 2018
Fundamentally justified?
Synchronised expansion had ended
US accelerating, China slowing
USA Global China
23
Initially it had seemingly no impact at all, but
and so had central banks’ easy money
24
…renewed worries about corporate credit default gripped stock markets
and when as a result US yields crossed the ‘magic’ 3.2% barrier
Investor liquidity disappeared to China, cash and government bonds
Lothar Mentel
CIO Tatton Investment Management 6 November 2018
Source: Hedgeye – online, 2018 The September US ISM business sentiment index hitting an unexpected high pushed the yield of US 10 year Treasury bonds to 3.2% and thus paradoxically brought the 2018 US stock market rally to an abrupt end
For professional adviser use only
Ensuing sell-off suggesting imminent global recession
From exuberance to temporary bear market in under 12 months
S&P500 trend channel since 2016; Source: Bloomberg, 30 Jan 2019
Liquidity squeeze (QT) – End of cycle fears – Slowing growth
27 www.tattoninvestments.com | Tel: 02071902959 | 125 Old Broad Street, London, EC2N 1AR | @TattonIM
28 www.tattoninvestments.com | Tel: 02071902959 | 125 Old Broad Street, London, EC2N 1AR | @TattonIM
29 www.tattoninvestments.com | Tel: 02071902959 | 125 Old Broad Street, London, EC2N 1AR | @TattonIM Key capital market returns for 2018; Source: Morningstar, 28 Feb 2019 Note: Past Performance is no guarantee for future returns. Index returns do not take into account the cost of advice and the cost of investing
Starting position EU and Jap
UK underweight Mar 6th: EM equity underweight June: Asia underweight, Strategic Bonds and Long/Short fund Introduced July/August: US underweight UK back to neutral Asia underweight Late October Rebalance
3% Cash to Alternatives February rebalance +EM, back to equity neutral
Current positioning: Under/over weights by risk profile
30 www.tattoninvestments.com | Tel: 02071902959 | 125 Old Broad Street, London, EC2N 1AR | @TattonIM
Further volatility but with upside
Note: Cash = 0 duration bonds
selective underweight due to lack
to credit, equity, yield risk
Regional equity under / over-weights by risk profile
31 www.tattoninvestments.com | Tel: 02071902959 | 125 Old Broad Street, London, EC2N 1AR | @TattonIM
Upside on global trade rebound and subsiding US$ strength
Upside from China rebound
Still too expensive
Upside from China rebound
Excessively discounted for Brexit
The positives and negatives
++ 5% equity underweight from February 2018 (closed Feb 2019) ++ Emerging market underweight from early March 2018 (closed Feb 2019) ++ Full US allocation until August 2018 + UK underweight until August 2018
Europe and Japan overweight
33 www.tattoninvestments.com | Tel: 02071902959 | 125 Old Broad Street, London, EC2N 1AR | @TattonIM
Tatton IA Sector Relative to IA Tatton IA Sector Relative to IA Tatton IA Sector Relative to IA 3 yr Annualised Volatility
Defensive 3.5% 3.7%
0.7% 4.7% 4.0% 0.7% 3.9 Cautious 4.6% 5.0%
0.8% 6.4% 5.2% 1.2% 5.3 Balanced 5.3% 5.8%
0.0% 7.5% 6.2% 1.3% 6.4 Active 6.3% 6.5%
8.6% 7.2% 1.4% 7.8 Aggressive 7.1% 6.3% 0.8%
9.3% 7.2% 2.1% 9.1 Global Equity 8.2% 6.3% 1.9%
0.2% 7.2% 5.7% 1.5% 10.5
Since Launch (Annualised %) Tatton Managed (Overlay) YTD 2018
Investment returns – Tatton Managed vs. IA peers (March 2019)
Note: To 31st January 2019; Tatton returns after DFM charge and underlying fund costs; Global Equity portfolio strategies only launched Nov 2013 Inception Dates: Tatton Managed Defensive – Aggressive: 01/01/2013 Tatton Managed Global Equity: 31/10/2013
Tatton IA Sector Relative to IA Tatton IA Sector Relative to IA Tatton IA Sector Relative to IA 3 yr Annualised Volatility
Defensive 3.4% 3.7%
1.6% 4.9% 4.0% 0.9% 3.6 Cautious 4.7% 5.0%
1.9% 6.1% 5.2% 0.9% 4.9 Balanced 5.4% 5.8%
1.3% 7.2% 6.2% 1.0% 6.0 Active 6.2% 6.5%
0.6% 8.5% 7.2% 1.3% 7.3 Aggressive 7.1% 6.3% 0.8%
0.2% 9.6% 7.2% 2.4% 8.4 Global Equity 7.9% 6.3% 1.6%
2.5% 7.5% 5.7% 1.8% 9.8
Tatton Tracker YTD Since Launch (Annualised %) 2018
Investment returns – Tatton Tracker vs. IA peers (March 2019)
Note: To 31st January 2019; Tatton returns after DFM charge and underlying fund costs; Global Equity portfolio strategies
Inception Dates: Tatton Tracker Defensive – Aggressive: 01/01/2013 Tatton Tracker Global Equity: 31/10/2013
Tatton IA Sector Relative to IA Tatton IA Sector Relative to IA Tatton IA Sector Relative to IA 3 yr Annualised Volatility
Defensive 3.4% 3.7%
1.1% 5.0% 4.0% 1.0% 3.7 Cautious 4.6% 5.0%
1.4% 6.4% 5.2% 1.2% 5.1 Balanced 5.3% 5.8%
0.7% 7.5% 6.2% 1.3% 6.1 Active 6.2% 6.5%
8.7% 7.2% 1.5% 7.4 Aggressive 7.1% 6.3% 0.8%
9.3% 7.2% 2.1% 8.7 Global Equity 8.0% 6.3% 1.7%
1.4% 7.4% 5.7% 1.7% 10.0
Since Launch (Annualised %) YTD Tatton Core (Overlay) 2018
Investment returns – Tatton Core vs. IA peers (March 2019)
Note: To 31st January 2019; Tatton returns after DFM charge and underlying fund costs; Global Equity portfolio strategies
Inception Dates: Tatton Core Defensive – Aggressive: 01/01/2013 Tatton Core Global Equity: 31/10/2013
Tatton IA Sector Relative to IA Tatton IA Sector Relative to IA Tatton IA Sector Relative to IA 3 yr Annualised Volatility
Defensive 3.0% 3.7%
1.5% 4.2% 3.4% 0.8% 3.7 Cautious 4.1% 5.0%
2.2% 5.3% 4.2% 1.1% 4.5 Balanced 4.6% 5.8%
1.9% 5.9% 5.0% 0.9% 5.3 Active 5.4% 6.5%
1.7% 7.0% 5.8% 1.2% 6.3 Aggressive 6.0% 6.3%
1.4% 7.6% 5.8% 1.8% 7.3
YTD Since Launch (Annualised %) Tatton Income 2018
Investment returns – Tatton Income vs. IA peers (March 2019)
Note: To 31st January 2019; Tatton returns after DFM charge and underlying fund costs; Global Equity portfolio strategies
Inception Dates: Tatton Income Defensive – Aggressive: 01/08/2014
Tatton IA Sector Relative to IA Tatton IA Sector Relative to IA Tatton IA Sector Relative to IA 3 yr Annualised Volatility
Defensive 4.9% 3.7% 1.2%
0.2%
Cautious 6.2% 5.0% 1.2%
Balanced 7.1% 5.8% 1.3%
0.7% 6.5% 5.4% 1.1% 6.3 Active 8.0% 6.5% 1.5%
Aggressive 9.0% 6.3% 2.7%
0.3% Global Equity 9.6% 6.3% 3.3%
0.3%
Since Launch (Annualised %) YTD Tatton Ethical 2018
Investment returns – Tatton Ethical vs. IA peers (March 2019)
Note: To 31st January 2019; Tatton returns after DFM charge and underlying fund costs Inception Dates: Tatton Ethical Balanced: 06/12/2014 Tatton Ethical Defensive, Cautious, Active, Aggressive, Global Equity: 27/01/2018
Investment Returns – Tatton Managed vs. IA Peers (Feb 2019)
39 www.tattoninvestments.com | Tel: 02071902959 | 125 Old Broad Street, London, EC2N 1AR | @TattonIM Inception Dates: Tatton Managed Defensive – Aggressive: 01/01/2013, Tatton Managed Global Equity: 31/10/2013
Tatton IA Sector Relative to IA Tatton IA Sector Relative to IA Tatton IA Sector Relative to IA 3 yr Annualised Volatility
Defensive 2.1% 2.4%
0.7% 4.7% 3.8% 0.9% 3.9 Cautious 3.1% 3.7%
0.8% 6.4% 5.1% 1.3% 5.3 Balanced 4.0% 4.3%
0.0% 7.5% 6.1% 1.4% 6.4 Active 5.1% 4.8% 0.3%
8.6% 7.0% 1.6% 7.8 Aggressive 6.0% 4.9% 1.1%
9.3% 7.1% 2.2% 9.1 Global Equity 6.1% 4.9% 1.2%
0.2% 7.2% 5.5% 1.7% 10.5
2018 Tatton Managed (Overlay) YTD Since Launch (Annualised %)
40 www.tattoninvestments.com | Tel: 02071902959 | 125 Old Broad Street, London, EC2N 1AR | @TattonIM
Administration, advice and DFM charges are all clear performance drags The same cannot be said with the same confidence for stock picking vs tracker based portfolio strategies
Our observation is that the return differences from year to year are driven by the style impact of the different investment universes. Professional manager selection appears to
cost differences
Sources: Nucleus, Tatton, Bloomberg Inception date – 20/10/2016 Performance figures gross of fees
Index Inception Diff YTD YTD Diff 3M 3M Diff Tatton AIM 20.30 5.00
FTSE AIM 13.30 7.00 6.00
1.40 FTSE All Share 11.40 8.90 6.60
2.60
FTSE Small Cap 16.20 4.10 5.20
1.40
FTSE 250 13.50 6.80 9.90
4.20
AIM Portfolio FTSE All Share FTSE AIM All Share Portfolio Info: Number of Holdings 48 636 813 Standard Deviation - Annualised* 9.1 10.6 9.7 Total Return* 10.1% 6.1% 2.9% Sharpe Ratio* 0.5 0.3 0.1 Beta of Portfolio to index* 0.5 0.7 Correlation of Portfolio to index* 0.5 0.8 Max Drawdown
Length of Drawdown (days) 83 157 82
*2 Years to 28/02/2019
Weights to 28/02/2019
Source: Tatton / Bloomberg / Nucleus
Top 10 Holdings % Holding Sector Main area of business NEXUS INFRASTRUCTURE PLC 3.5 Capital Goods Specialised infrastructure services. STRIX GROUP PLC 3.2 Technology Hardware & Equipment Design, manufacture and supply of kettle safety controls. RAMSDENS HOLDINGS PLC 3.1 Diversified Financials Foreigh Exchange, pawnbroking and retail services. BURFORD CAPITAL LTD 3.1 Diversified Financials Litigation finance. ABCAM PLC 3.0 Pharma, Biotech & Life Sciences Distributes antibodies and associated protein research tools. FOCUSRITE PLC 2.9 Technology Hardware & Equipment Develops, manufactures and markets eleectronic music products. IDEAGEN PLC 2.9 Software & Services Information Management to regulated industries. YOUGOV PLC 2.9 Commercial & Prof Services Engages in market research and data analytics. CLINIGEN GROUP PLC 2.8 Pharma, Biotech & Life Sciences Provides access to pharmaceuticals and services globally. GB GROUP PLC 2.8 Software & Services Identity management software specialist.
45 www.tattoninvestments.com | Tel: 02071902959 | 125 Old Broad Street, London, EC2N 1AR | @TattonIM
46
Our outlook slide of last quarter: Q3 2018
47 www.tattoninvestments.com | Tel: 02071902959 | 125 Old Broad Street, London, EC2N 1AR | @TattonIM
US gov. bond yields back below 3% (2.4% actually)
Source: US FRED, 14 Mar 2019
48 www.tattoninvestments.com | Tel: 02071902959 | 125 Old Broad Street, London, EC2N 1AR | @TattonIM
49 www.tattoninvestments.com | Tel: 02071902959 | 125 Old Broad Street, London, EC2N 1AR | @TattonIM
Equity valuations – back below long term average
Source: JP Morgan, 31 Dec 2018
50 www.tattoninvestments.com | Tel: 02071902959 | 125 Old Broad Street, London, EC2N 1AR | @TattonIM
51 www.tattoninvestments.com | Tel: 02071902959 | 125 Old Broad Street, London, EC2N 1AR | @TattonIM
Source: Morningstar / Tatton IM, 31 March 2019
Note: Past Performance is no guarantee for future
purposes only Returns shown do not take into account the cost of advice and the cost of platform administration
Awkward situation of slowing economy vs. recovering stock markets
52 www.tattoninvestments.com | Tel: 02071902959 | 125 Old Broad Street, London, EC2N 1AR | @TattonIM
53 www.tattoninvestments.com | Tel: 02071902959 | 125 Old Broad Street, London, EC2N 1AR | @TattonIM
The cynics view – but there is some substance to it… …stability of credit markets remains central bank dependent
54 www.tattoninvestments.com | Tel: 02071902959 | 125 Old Broad Street, London, EC2N 1AR | @TattonIM
55 www.tattoninvestments.com | Tel: 02071902959 | 125 Old Broad Street, London, EC2N 1AR | @TattonIM
56 www.tattoninvestments.com | Tel: 02071902959 | 125 Old Broad Street, London, EC2N 1AR | @TattonIM
Given resilient global economy, 2019 potentially flipside of 2018 in capital markets?
Source: MRB Research, 15 Feb 2019
57 www.tattoninvestments.com | Tel: 02071902959 | 125 Old Broad Street, London, EC2N 1AR | @TattonIM
Source: MRB Research, 15 Feb 2019
Tatton’s central case: Positive trend but volatility risk
Growth continues, but susceptibility to shock risk remains high 1. Continued economic growth supports further earnings growth 2. but QT suppresses global liquidity can cause further unnerving volatility 3. US$ now more likely to weaken and thereby support global trade and EM 4. US-China trade war likely resolved soon - but beware of Trump risk to EU trade 5. QE worked by bringing asset returns forward = less returns potential left 6. No-deal Brexit perspective superseded by Brexit postponement = 2018 repeat Back to slow but steady growth – but markets likely to remain volatile
58 www.tattoninvestments.com | Tel: 02071902959 | 125 Old Broad Street, London, EC2N 1AR | @TattonIM
Patrick Blower – Contempt of parliament, Source: Political Cartoon Gallery London, 5 Dec 2018
No-Deal Brexit would cause a shock recession – not just in the UK May’s deal is less good than continued membership benefits, but provides perspective Another referendum may stop Brexit, but leaves UK society divided and upset Scenario investment assessment: 1. No Brexit = significant UK risk asset rebound 2. May’s deal = Some rebound of £-Sterling and boost for small and mid cap stock 3. Postponement without referendum = 2018 repeat but slowly getting worse 4. Postponement + 2nd referendum = outcome dependent, but political instability upset Uncertainty will not end 29 March, but unless No Deal, limited global investment impact
60 www.tattoninvestments.com | Tel: 02071902959 | 125 Old Broad Street, London, EC2N 1AR | @TattonIM
Repeat of post 2013 and post 2016 market environment plausible
61 www.tattoninvestments.com | Tel: 02071902959 | 125 Old Broad Street, London, EC2N 1AR | @TattonIM
62 www.tattoninvestments.com | Tel: 02071902959 | 125 Old Broad Street, London, EC2N 1AR | @TattonIM
Important Information This document is solely for the use of professionals and is not for general public distribution
Tatton Investment Management Limited is authorised and regulated by the Financial Conduct Authority. Financial Services Register number
England and Wales No. 08219008. Registered address: Paradigm House, Brooke Court, Wilmslow, Cheshire, SK9 3ND