SLIDE 15 15
TS &OCr
pate
.
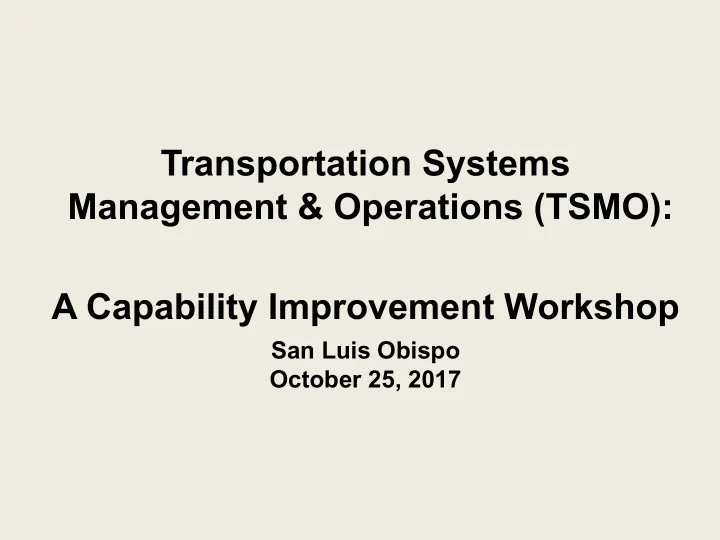
Level Criteria for
- 1. Performed
- 2. l\'.lana·
!!ed
- 3. Integrated
- 4. Optimizing
Dimensions
Each juris,d ictio n ,
does its
Consensus regiona l approach
RJegio n al progr:am
TSM &O integr c!Jte d into
Business proc, esses
accord ing to
d!eve lo pe d rega rdinig goals,
i nt, egrat e d into j 1.1 ris,d ict io ns" m1.1 lt i-~ W!Jjjil
(P'lanning,
in d iv id1.1al priorit ies , an d
defici e ncies, B/ C, networks,
j u r is,d i, ct io rns" o v e rail p lans , an d p rograms, b asie d c apab ilit ies m u lt im odal t r ansportat io n
programming),
strategies and common
p lans w it h r, e I albe d stage d p lann ing p roc , es,ses
prio rit ies
progr am Ad h,
approac h es to
Regio na l conop s and
Syst e ms .& t, ec h nol-
A re h it ectu r, es , and t ee h no,l,ogy I syste m im p le m e nt at ion
a rchit ect ures deve lope d a nd
stan d ,mdiz.e d , and rout in e ly 1.1 pgr ad e d to
Syst ems , e ngi n e, e ring,
w ilthto ut consid e r atio n o f
d!ocum e nt e d wit h costs
im tegrat ed w it ht su p p ort iv e im p ro v e p erfo r m ance; syste ms , e ng in ee r ing ; and , d e, c isio n-su pp
e I albe d sy st e ms
and t, e, chnology
appro,priate proc 1.1ne m e m t
inclu:d!ed; appropriate PO &
prooess,es and traini'ng ,
as i nt egr;at io n/ i m t, e rop e ra b i I ity
prooes,s,es
procure m e nt process e mploye d
, appropriate m aintain e d on cont inu ing b asis So m e outp 1.1ts m e, as1.1 ne d
Output data ui
s• e d di re ct ly for
O L1tco m e m easures P, e rfor m am
as1.1 nes , and reporte d
afte r-action de bri efings and
id e nt if ie d (n etworks, re p orted int e rn ally for Pie rformanc,e m o d es, im p acts) , and
1.1t ilizat io n ,
and exte rn ally for
improvements; data e asily
m easu r, e m e nt,
ro,
1.1t in e ly ut ilized for re .
al- , acco1.1 ntab i I ity , and prog r;am
ava ila ble and dashboard!e d
t im e o bj ectiv e-ba5le d j 1.1st if ication
progr am impro v em e nts
ln d iv id 1.1al St aff
J uri sdi
cti
RJegio n al coms,e ns1.1s o n
Custom e r m o b ility s,e rv ioe , ch am p io m s promolbe
managem e nt unde rstands
m is,sio n, p r io r it ies , an d
com m it m e nt ,
acco1.1 m t.ab i I ity ,Oultur,
e, l, eadership,
TSM &O
TSM&O business case and
b e n ef its w it h form al , acoe plbe d as form al, top lev el
prog r am and ,
ac htiev es
core prog ram o f all
e du:cate s de ci.si
w id e p ub lic j 1.1 ris,d ictio ms
ma ke rs/ public
v isib ility/ 1.1nderst and ing TSM &O , add e d on to un its
TSM&0-5pecific o rga nizat iona l
TSM &O M an age rs ht av e TSM &O s,e n ior m an age rs , at
Organizational
w it ht in , ex istim g structu rie
concept deve lope d
, d ir, ect r, e p ort to to p , eq u iv, ale nt lev el w it ht otht e r
st ructure/st aff
, and s1t, afling - , d ep e n d e nt
wit hin/
among jurisdictions wit h
m an age m e nt; Job sp ecs, j 1.1 r'is,d ict iom s,e rvioes am d staff
- n t ec htnical chtam p io m
s
ce rt if ication ,
amd t r ain ing p rof, es,sion al iz.e d
, capabiliti,es
core capacity needs ide ntifie d,
fo r core p osit io ms
collaboration ta kes place
RJe lat io nshtips ad htoc,.
, a,nd
Object ives, strategies and
Ra, t ion al i. zat io m / sht ar i
ng/for
High lev e l o f TSM &O
External collaboration
- n p e rs,o n al basis (p u b li,
c-
pe rformance m easures a lig ne d
m aliz.at io m of ,
coord in ati'o m
am o ng
pu bl k , private
pub li,
c, pu b lic- pri'v,
ate )
- ~~.-
- --; ~ .- ---;.-.1""'11,: - ~--11 • ·~•- -•--·
- -·
- r,esponsib ilit ies ,
am o ng ke y
- w n e r/ op e rat o rs (state ,
p lay e rs t htrough co- loc, al, p r ivat e )
TSM&O Criteria Template