
SLIDE 1
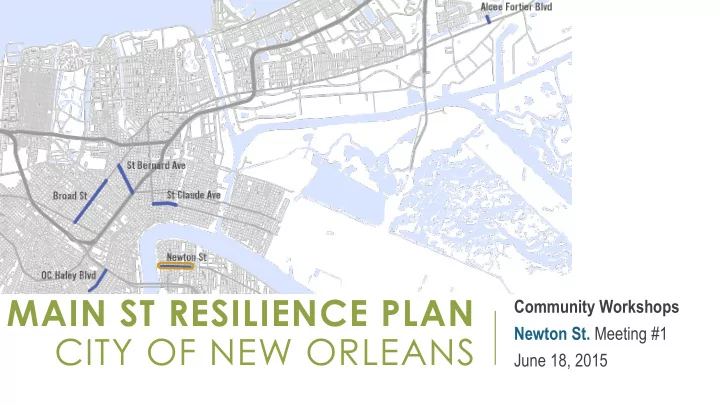
MAIN ST RESILIENCE PLAN CITY OF NEW ORLEANS
Community Workshops Newton St. Meeting #1 June 18, 2015
MAIN ST RESILIENCE PLAN Community Workshops Newton St. Meeting #1 - - PowerPoint PPT Presentation
MAIN ST RESILIENCE PLAN Community Workshops Newton St. Meeting #1 CITY OF NEW ORLEANS June 18, 2015 AGENDA Welcome & Introductions Project Overview Defining resilience Coordination with other planning efforts What Weve
Community Workshops Newton St. Meeting #1 June 18, 2015
2
3
4
5
City Planning Commission Metro-So Source, urce, llc llc
PAC Meeting #3
6
Initialization
Assessment
Analysis & Recommendations
Final Plan
PAC Meeting #1 PAC Meeting #2 PAC Meeting #4
March / April May / June July / August August / September Corridor workshops 1 Business workshops Community meetings Corridor workshops 2 Public presentations
drawn from the Rockefeller Foundation 100 Resilient Cities
7
MASTER PLAN: RESILIENCE (Chapter 12)
risks
drawn from the Community and Regional Resilience Institute (CARRI)
forces?
…essential services on an ongoing basis & immediately following a shock event? …emergency shelter? …social & community gathering spaces?
needed to weather shocks & stresses?
stresses?
8
9
Residential and Commercial Market Infrastructure / Built Environment Risk and Other Resilience Elements
11
12
Number Industry Examples 7 Membership Organizations Churches 7 Food stores Groceries, convenience stores 6 Construction Special Trade Contractors Plumbing, heating, electric, painting, masonry, roofing, demolition, etc. 6 Social Services Childcare, aging, homeless
13
Sources: InfoUSA, 2015; City of New Orleans
14
Sources: InfoUSA, 2015; City of New Orleans
50 100 150 200 250 300 350 400 450 before 1990 1990 to 1994 1995 to 1999 2000 to 2004 2005 to 2009 2010 to 2015
Entities by Year Started - All Corridors
Business Non-Business 2 4 6 8 10 12 14 before 1990 1990 to 1994 1995 to 1999 2000 to 2004 2005 to 2009 2010 to 2015
Entities by Year Started - Newton Street
Business Non-Business
15
0.0% 2.0% 4.0% 6.0% 8.0% 10.0% 12.0% Newton 0.1 Mile Radius Newton 0.25 Mile Radius Newton 0.5 Mile Radius New Orleans
Population Change, 2010-2015
16
32 33 34 35 36 2010 2015
Median Age
Newton 1/4 Mile Orleans Parish
0% 10% 20% 30% 40% 50% 0-19 20-34 35-49 50-64 65-79 80+
Age Group Rate of Change, 2010-2015
Newton Change New Orleans Change
17
$- $10,000 $20,000 $30,000 $40,000 Newton 1/4 Mile New Orleans
2013 Median HH Income
0% 10% 20% 30% 40% Over $100,000 $50,000-$99,999 $35,000-$49,999 $20,000-$34,999 Under $20,000
Houshold Income Groups, 2013
New Orleans Newton 1/4 Mile
18
$- $50,000 $100,000 $150,000 $200,000 Median Home Value
Median Home Value
Newton 1/4 Mile New Orleans $745 $750 $755 $760 $765 $770 Median Rent
Median Rent
Newton 1/4 Mile New Orleans
19
64.4% 35.6% 52.7% 47.3%
Own vs. Rent Homes
0.0% 10.0% 20.0% 30.0% 40.0% Newton 1/4 Mile New Orleans
Rent as Percentage of Income
20
21
22
23
food, pharmacy)
furniture, electronics, hobby goods)
institutions, specialty items)
Source: Esri 2015
. 24
Source: Esri and Dun & Bradstreet, 2015, GCR Analysis
25
26
PRELIMINARY FEMA DFIRM Large portions of Newton are in AE Zone (100-year flood)
27
28
29
30
31
Highest concentration of 911 call in 2014
0.0% 10.0% 20.0% Other Property Traffic Vice Violent All Calls
Change in NOPD Calls, 2012-2014
New Orleans Newton
32
34
36
Photo credit: Robert Morris, Uptown Messenger
37
Dwight Norton – GCR dnorton@gcrincorporated.com Judith Dangerfield – Metro Source judithdangerfield@metro-source.com
38