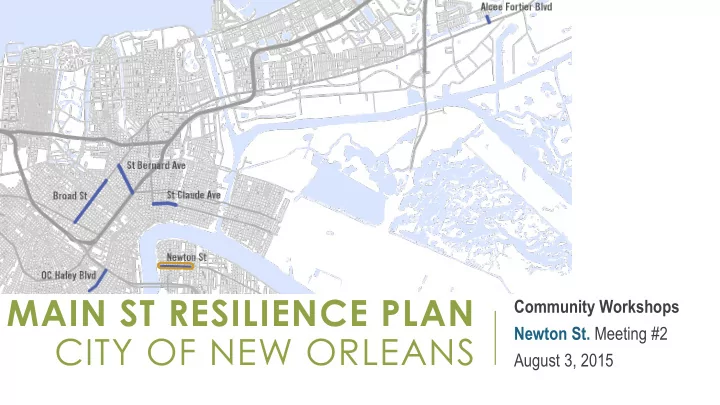
main st resilience plan
play

MAIN ST RESILIENCE PLAN Community Workshops Newton St. Meeting #2 - PowerPoint PPT Presentation

MAIN ST RESILIENCE PLAN Community Workshops Newton St. Meeting #2 CITY OF NEW ORLEANS August 3, 2015 AGENDA Welcome & Introductions Project Overview Vulnerability Assessment Preliminary Findings Shocks & Stresses


  1. MAIN ST RESILIENCE PLAN Community Workshops Newton St. Meeting #2 CITY OF NEW ORLEANS August 3, 2015

  2. AGENDA • Welcome & Introductions • Project Overview • Vulnerability Assessment Preliminary Findings • Shocks & Stresses • Infrastructure • Buildings • People • Discussion on Resiliency Strategies 2

  3. Goals PROJECT OVERVIEW Schedule Community Engagement 3

  4. PROJECT GOALS City Planning Commission 1. Developed a shared definition of resilient commercial corridors for New Orleans 2. Create a measurable and actionable methodology for assessing the resilience of commercial corridors or Metro-So Source, urce, llc llc Main Streets. 3. Apply methodology to 6 corridors (5 State-designated Main Streets), in the city and develop individualized recommendations for each to address resiliency gaps 4. Develop how-to guides for businesses for improving resiliency as applied to business operations and for businesses/property-owners for improving building resiliency 4

  5. OVERVIEW OF PLANNING PROCESS • Defining Resilience for Main Streets March / April • Review Previous Efforts Initialization PAC Meeting #1 • Develop standardized assessment PAC Meeting #2 • Data collection (primary) May / June Assessment • Business occupant survey Corridor workshops 1 Business workshops • Commercial and residential market analysis July / August PAC Meeting #3 • Resilience gap analysis Analysis & • Infrastructure improvements and revitalization strategies Corridor workshops 2 Recommendations PAC Meeting #4 Community meetings • Technical guides: business operations & building hardening August / September • Draft and final plan; public presentations Final Plan Public presentations 5

  6. Residential and Commercial Market WHAT WE’VE LEARNED Infrastructure / Built Environment Risk and Other Resilience Elements

  7. ASSESSING A RESILIENT COMMERCIAL CORRIDOR • How vulnerable are corridor facilities and users to shock events • Does the corridor facilitate economic prosperity that can withstand times of stress? • Do corridor businesses have access, availability, and the capacity to engage resources needed to weather shocks & stresses? • Are adequate social networks in place to support corridor businesses during shocks and stresses? 7

  8. ASSESSMENT: KEY POINTS • Despite historic lack of major storm damage, there are important vulnerabilities that should be addressed • Market primarily supports local, neighborhood focused businesses • Enhancing the customer base and improving the business environment should take advantage of existing conditions by focusing on housing opportunities and access • Prioritizing development nodes & catalytic projects could spark economic development • Crime is a major concern for the community. The perception of safety needs to be enhanced. 8

  9. INFRASTRUCTURE & SHOCK EVENTS • Significant portion of corridor in Flood Zone • Low historic flood policy claim rate • Significant number of catch basins in below average or worse condition (54%) • Community has not identified storm damage as a major problem in past 9

  10. BUILDINGS & SHOCK EVENTS • High proportion of: • Buildings on grade (71%) • Unprotected windows & doors (69%) • MEP not elevated (58%) • Strengths • Relatively low number of buildings in below average or worse condition (23%) • Few connected downspouts (2.7%) 71.0% Foundation on grade 69.0% Unprotected windows or doors 23.0% In 'below average' or worse condition 2.7% Connected Downspouts (lower is better, does not overload system) 58.0% MEP not elevated 10

  11. MARKET ANALYSIS • Neighborhood-serving, locally owned, convenience market • Only major anchor is Federal City • Moderate unmet demand: • General Merchandise: $3.2 million • Electronics and Appliances: $2.3 million • Food Services and Drinking: $1.4 million • Clothing and Accessories: $1.4 million • Health Care and Personal Care: $1.3 million • 94% of people who work in area do not live there 11

  12. PEOPLE Population Change, 2010-2015 Population immediately 12.0% surrounding Newton has grown 10.0% at a significantly slower pace 8.0% than the rest of the city 6.0% 4.0% 2.0% 0.0% Newton 0.1 Newton Newton 0.5 New Mile Radius 0.25 Mile Mile Radius Orleans Radius 12

  13. HOUSING • Median home values are significantly lower than rest of city, and prices have not been rising as rapidly( 11% increase since 2009 near Newton vs. 32% citywide) • Rents are similar to city as a whole Median Home Value Median Rent $200,000 $780 $183,700 $150,000 $765 $765 $100,000 $105,859 $750 $754 $50,000 $- $735 Median Home Value Median Rent Newton 1/4 Mile New Orleans Newton 1/4 Mile New Orleans 13

  14. HOUSING • More people rent near Newton, and rent is a higher percentage of household income than the rest of the city Own vs. Rent Homes Rent as Percentage of Income 40.0% 30.0% 47.3% 52.7% 20.0% 10.0% 64.4% 35.6% 0.0% Newton 1/4 Mile New Orleans 14

  15. HOUSING • Vacancy by adjacent neighborhood: • Whitney: 25.3% • Behrman: 24.5% • McDonough: 35.4% • Algiers Point: 18.5% • US Naval Support Area: 17.6% 15

  16. DISCUSSION: IMPROVING RESILIENCE

  17. ENHANCE CUSTOMER BASE • Increase affordable housing opportunities near the corridor • Population growth significantly lower than rest of city • Housing costs lower than rest of city • Improve access to the corridor • Highlight connections to the ferry & MS River trail • Consider minor changes to bus routes to encourage travel to the corridor 17

  18. IDENTIFY DEVELOPMENT OPPORTUNITIES • Nodes for priority investment • Important intersections, key blocks • Affordable property may encourage investment • Potential catalytic projects & development sites • Deep South Movie Studie • Blain Kern / Former Mardi Gras World • Vacant Properties, Light Industrial Sites • Coordinate with stakeholders to champion redevelopment • Federal City • Preservation Resource Center • NORA 18

  19. INCREASE PERCEPTION OF SAFETY • Define & enhance public gathering spaces • Enhance relationships and develop formal arrangements among residents and businesses • Neighborhood watch or security district • Business Improvement District or Community Development Corporation 19

  20. REDUCE VULNERABILITY TO SHOCKS • Develop and distribute building hardening guides • Significant portion of corridor is in flood zone • Most businesses are at grade (71%) • Emphasize need for continuity planning • Enhance buy-in, engagement 20

  21. Tom Haysley – GCR THANK YOU thaysley@gcrincorporated.com Judith Dangerfield – Metro Source judithdangerfield@metro-source.com 21

Download Presentation
Download Policy: The content available on the website is offered to you 'AS IS' for your personal information and use only. It cannot be commercialized, licensed, or distributed on other websites without prior consent from the author. To download a presentation, simply click this link. If you encounter any difficulties during the download process, it's possible that the publisher has removed the file from their server.

Recommend


More recommend