Machine Learning for Trading Financial Investing Technical - - PowerPoint PPT Presentation

machine learning for trading
SMART_READER_LITE
LIVE PREVIEW

Machine Learning for Trading Financial Investing Technical - - PowerPoint PPT Presentation

Efficient Markets Hypothesis (does not support our assumption) Assumption: We can gain advantage in the market from exploiting different sources of information Machine Learning for Trading Financial Investing Technical Analysis:


slide-1
SLIDE 1

Machine Learning for Trading Financial Investing

The Fundamental Law

  • f active portfolio management

Efficient Markets Hypothesis (does not support our assumption)

Assumption: We can gain advantage in the market from exploiting different sources of ‘information’ Technical Analysis:

  • Historical Price (movements – are not random).
  • Volume

Fundamental Analysis:

  • Features of the intrinsic value of a stock, e.g.,

earning.

General Investment Intuition News (Information) of a Company

Good news

  • Stock price goes

up!

  • Good investment

Bad news

  • Stock price goes

down!

  • Poor investment

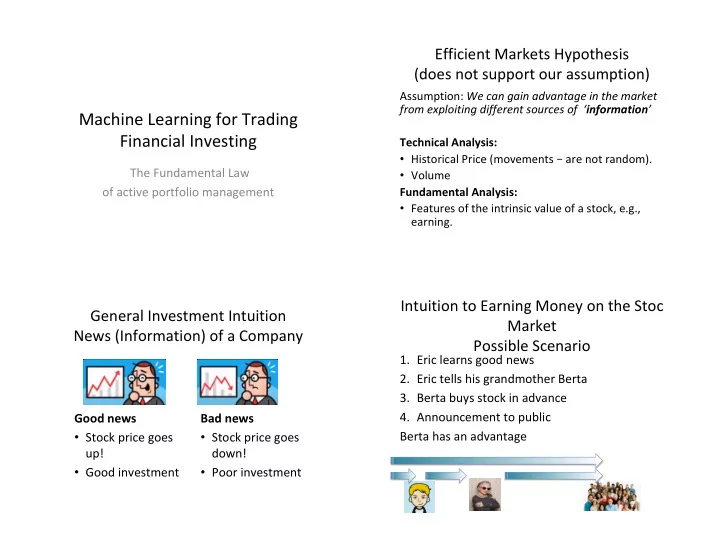
Intuition to Earning Money on the Stoc Market Possible Scenario

  • 1. Eric learns good news
  • 2. Eric tells his grandmother Berta
  • 3. Berta buys stock in advance
  • 4. Announcement to public

Berta has an advantage

slide-2
SLIDE 2

Efficient Market Hypothesis

  • Instant Information Flow

– Eric, Grandmother, and Public Learn about the news at the same time.

Efficient Markets Hypothesis

  • All relevant information flows instantly - or

super quickly – no one can take advantage of slow flowing information to gain an advantage.

  • Any information is available instantly in a

[perfectly] efficient market.

  • Reflect: Both Fundamental & Technical

Analysis are based on information so they are useless in a [perfectly] efficient market.

Efficient Market Hypothesis

  • Jules Regnault, 1863
  • Eugene Fama, 1960s (formalized the idea)
  • Stocks trade at their fair value

– impossible for investors to either purchase undervalued stocks or sell stocks for inflated prices.

https://en.wikipedia.org/wiki/Efficient-market_hypothesis

Information: From public to less public

  • Price volume (most public)
  • Fundamental (intrinsic value)
  • Exogenous

– other or related information affecting price that is not intrinsic information

  • Example price of oil may affect a company making

cars.

  • Insider Information.
slide-3
SLIDE 3

Efficient Market Hypothesis Forms

  • Weak

– Future price cannot be predicted by analyzing historical prices à Technical Analysis cannot work

  • Semi-Strong

– Prices adjust rapidly to new public information à Fundamental Analysis cannot work

  • Strong:

– Prices reflect all information, public an private. à No analysis relying on ANY information (including insider information) cannot work

slide-4
SLIDE 4

EMH Prohibits

þþþ

  • þþ

þ Technical Fundamental Insider

Weak Semi Strong Strong

EMH Prohibits

  • Technical

Fundamental Insider

Weak Semi Strong Strong

Case Study (Estimating Value of a Stock)

  • Look at Price Earning

Ratio

– 33% of investment managers considers this ratio before buying stock. – 15-20 PE Ratio (AVG 15.54), typical on average – Question: What type of information is the PE Ratio? (Technical, Fundamental or Insider?)

  • Lower PE Ratio is better

– Intuition: Low PE Ratio means lower expectation

https://jbmarwood.com/historical-pe-ratios/

  • Stocks moves in direction of

their earning over time

  • PE ratio compares price of stock

to its recent earning.

  • Making money then stock price

will eventually go up and (low PE ratio, higher returns, low expectations, easier to

  • vercome)
  • Losing money it’s stock price will

go down (high PE ratio, lower returns)

slide-5
SLIDE 5
  • Low PE Ratio is better
  • A clear correlation

– Lower PE ratio is equal to better investment returns – Holds through each twenty year period.

  • Challenges:

– Stock market will adjust – Historical PE ratio not easy to come by.

Fundamental Law of Active Portfolio Management

  • Warrant Buffet:

– Wide diversification is only necessary when the investors do not know what they are doing.

  • Skill & Breath

– Skill – Selecting the right stocks. – Breath – number of investment opportunities

  • Grinold’s Fundamental Law:

– Performance = Skill * √ Breath

Casino Coin flip: Which is better?

  • 1 bias coin

– .51 heads à Win. – .49 tails à Lose.

  • 1,000 tokens that you can bet:
  • Which is better?

– 1,000 tokens that you can bet:

  • Bet 1 : 1 bet of 1,000 tokens
  • Bet 2: 1000 separate bets, one at a time.
  • Bet 3: Both are equivalent?

Casino Coin flip: Which is better?

  • 1 bias coin

– .51 heads à Win. – .49 tails à Lose. Bias – is our edge, our skill.

  • 1,000 tokens that you can bet:
  • Which is better?

– 1,000 tokens that you can bet:

  • Bet 1 : 1 bet of 1,000 tokens
  • Bet 2: 1000 separate bets, one at a time.
  • Bet 3: Both are equivalent?

(Probability of Winning) x (Amt Won per Bet) – (Probability of Losing) x (Amt Lost per Bet)

slide-6
SLIDE 6

Expected Return

  • Single Bet:

– 0.51 * $1,000 + 0.49 * -$1000 – 510 – 490 = $20.00 Profit.

  • Multi Bet:

– (0.51*1.00) – (0.49*-1) = .51-.49 = .02 c. – Make the bet 1,000 times: .02*1,000 = $20.00

Expected Return is the SAME

Risk: Take 1 – Lose it all.

  • Lose it All

– Bias Coin à .49 Losing.

  • Single Bet

– .49.

  • Multi Bet

– .49 * .49 * .49 … – [.49]1000 = really small chance you lose it all.

Risk: Take 2 –Standard Deviation.

  • Allocating bets differently across tables.

– 1 Extreme bet it all at one table

  • AT One table:

– Win 1,000, or Lose 1,000

  • AT Other tables (we did not bet on these)

– Outcome is 0.

  • Stdev(1000,0,0,0, … ) = 31.62

– 1 Extreme evenly distribute the bets 1 bet at each table.

  • 1 win, -1 lose
  • Stdev(-1,1,-1,1, … ) = 1.
  • à standard deviation is 1.

– Then there are the in-betweens.

  • Summary:

– Risk / Standard Deviation is much larger if we do 1 single Bet.

Coin flip: Reward/Risk

  • Combine

– Expected Return & Risk

  • Similar to the Sharpe Ratio
  • Reward/Risk à Expected Return/ StDev()
  • Single Bet:

– 20/31.62 = 0.63

  • Multi Bet:

– 20 / 1 = 20.

slide-7
SLIDE 7

Towards a Model.

  • Single Bet:

– 20/31.62 = 0.63 (SRsingle)

  • Multi Bet:

– 20 / 1 = 20.

  • Combine Single bet with Multi Bet
  • SRmulti = SR single * SQRT( 1,000 )
  • Performance improves with Breath.

– 1 single bet no improvement – 1000 spread maximum improvement.

  • Same relationship in active portfolio

management.

  • SRmulti = SR single * SQRT( 1,000)
  • Performance = Skill * SQRT(Breath)
  • Lessons:

– Higher Alpha (skill) à Higher SR – More Opportunities à Higher SR – SR grows with the SQRT(Breath).

  • Renaissance Technology

– 100K/day

  • Warren Buffet

– 120 Stocks

  • Information Ratio/Reward.

– Alpha encapsulate skill – Recall: Rp(t) = Beta Rm(t) + alpha – IR = mean(alpha)/stdev(alpha)

Fundamental Law

  • IR = IC * SQRT (BR)
  • IR – information Ratio
  • IC – Information Coefficient
  • BR – number of trading opporturnities
slide-8
SLIDE 8

Efficient Frontier.

  • Constraint in optimizer

is a particular expected return (recall in our

  • ptimizer the constrain

was that allocations summed to 1)

  • Markovitz Bullet
  • Maximum Sharpe Ratio