
SLIDE 1
Wirral Strategic Housing Market Assessment
- Median House
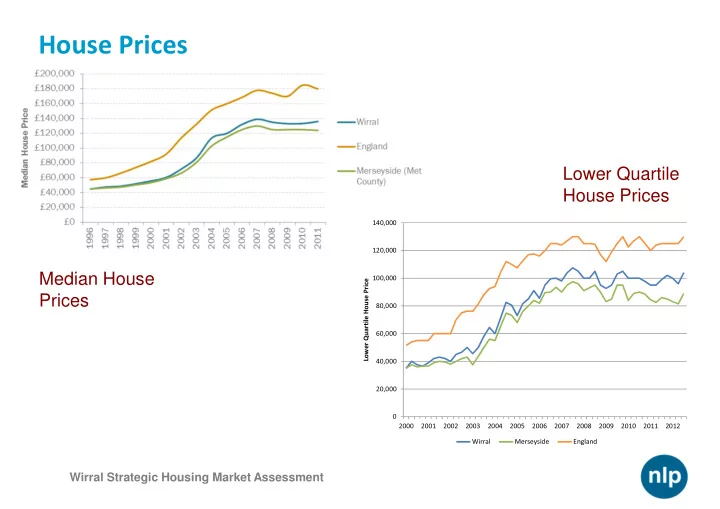
Lower Quartile House Prices - - PowerPoint PPT Presentation
Lower Quartile House Prices Median House Prices
Wirral Strategic Housing Market Assessment
Wirral Strategic Housing Market Assessment
Area 1) Wallasey Area 2) Commercial Core Area 3) Suburban Birkenhead Area 4) Bromborough and Eastham Area 5) Mid Wirral Area 6) Hoylake and West Kirby Area 7) Heswall Area 8) Rural Areas WIRRAL TOTAL AVERAGE £115,919 £75,018 £123,339 £147,694 £137,817 £234,996 £227,108 £271,564 £156,505 MEDIAN £105,000 £84,000 £108,000 £139,500 £125,000 £206,500 £180,000 £217,500 £132,500 LOWER QUARTILE £75,000 £50,000 £70,000 £110,000 £101,500 £148,375 £144,725 £142,000 £95,000 MINIMUM £15,000 £20,000 £11,500 £10,500 £25,000 £40,000 £56,000 £78,000 £10,500 MAXIMUM £475,000 £115,000 £820,000 £450,000 £448,000 £1,450,000 £1,225,000 £1,450,000 £1,450,000
558 17 825 701 567 424 411 51 3554 INCOME REQUIRED TO PURCHASE LQ HOUSE £21,429 £14,286 £20,000 £31,429 £29,000 £42,393 £41,350 £40,571 £27,143
Wirral Strategic Housing Market Assessment
Wirral Strategic Housing Market Assessment
Wirral Strategic Housing Market Assessment
2007 SHMA Annual Affordable Requirements based on CLG and BHM approach Council Area CLG Needs BHM Wirral 1,342 dpa 1,767 dpa
Wirral Strategic Housing Market Assessment
Wirral Strategic Housing Market Assessment
Wirral Strategic Housing Market Assessment
the minimum income required to access this housing (3.5 x income multiplier to purchase a home, or 25% gross household income to rent)
Wirral Strategic Housing Market Assessment
Wirral Strategic Housing Market Assessment
Wirral Strategic Housing Market Assessment
per sub-area, 100 surveys in the Commercial Zone (1,500)
Bands A-C, 1,646 excl. transfers)
Wirral Strategic Housing Market Assessment
Wirral Strategic Housing Market Assessment
Wirral Strategic Housing Market Assessment
Initial data analysis suggests a low level of affordable housing need BUT: significant mismatch between availability of stock and geographic needs; size and tenure. HNS will provide a clearer picture…
Wirral Strategic Housing Market Assessment
Wirral Strategic Housing Market Assessment
Bromborough & Eastham / Mid-Wirral / Hoylake & West Kirby / Heswall / Rural Areas?
funding regimes and the ‘bedroom tax’?