
SLIDE 1
01-25-2018
MANUEL PASTOR
LOOKING FORWARD:
EQUITY, PROSPERITY, & COMMUNITY IN A CHANGING (& DIVIDED) AMERICA
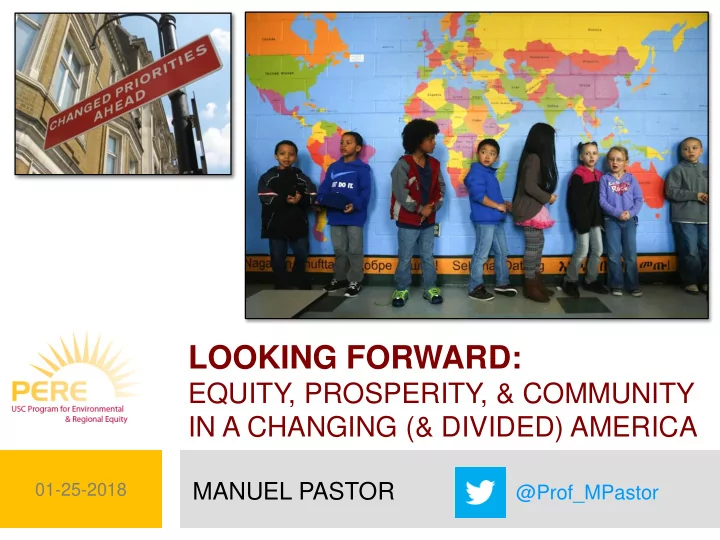
Source: http://www.flickr.com/photos/victoriabernal/8066930319/in/pool-ciclavia/
LOOKING FORWARD: EQUITY, PROSPERITY, & COMMUNITY IN A CHANGING - - PowerPoint PPT Presentation
Source: http://www.flickr.com/photos/victoriabernal/8066930319/in/pool-ciclavia/ LOOKING FORWARD: EQUITY, PROSPERITY, & COMMUNITY IN A CHANGING (& DIVIDED) AMERICA MANUEL PASTOR MANUEL PASTOR 01-25-2018 @Prof_MPastor Changing
Source: http://www.flickr.com/photos/victoriabernal/8066930319/in/pool-ciclavia/
80% 76% 69% 64% 59% 55% 51% 47% 12% 12% 12% 12% 12% 12% 13% 13% 6% 9% 13% 16% 19% 22% 24% 26% 3% 4% 5% 6% 7% 8% 8%
72% 70% 63% 56% 53% 50% 47% 44% 27% 27% 28% 30% 30% 30% 29% 28% 1% 2% 5% 9% 10% 12% 14% 15% 0% 1% 2% 3% 4% 5% 6% 7% 1% 2% 3% 3% 4% 5%
74% 71% 60% 51% 47% 44% 42% 40% 24% 25% 28% 32% 32% 31% 30% 28% 1% 2% 6% 10% 12% 13% 15% 16% 2% 3% 5% 6% 7% 9% 10%
284,920 795,632 1,046,993 458,133 382,924 142,213
People of Color Non-Hispanic White
27% 38% 129% 332% 18% 57% 360% 168% 6% 46% 110% 106%
Atlanta-Sandy Springs-Marietta, GA Metropolitan Statistical Area Georgia United States
13% 39% 131% 31% 80% 31% 92%
Note: Tracts with missing data are shaded white.
Note: Tracts with missing data are shaded white.
Note: Tracts with missing data are shaded white.
43 37 36 33 33 28 20 45 36 38 36 39 28 23
White All API Black Native American and Alaska Native Latino Other or mixed race
0% 5% 10% 15% 20% 25%
1917 1919 1921 1923 1925 1927 1929 1931 1933 1935 1937 1939 1941 1943 1945 1947 1949 1951 1953 1955 1957 1959 1961 1963 1965 1967 1969 1971 1973 1975 1977 1979 1981 1983 1985 1987 1989 1991 1993 1995 1997 1999 2001 2003 2005 2007 2009 2011 2013 2015
percent of income
Top 1% (incomes above $443,000 in 2015) Top 5-1% (incomes between $180,500 and $443,000) Top 10-5% (incomes between $124,800 and $180,500)
Source: Emmanuel Saez, Striking It Richer: The Evolution of Top Incomes in the United States (Update : August 31, 2016).
Source: IPUMS
4% 12% 22%
6% 17%
10th Percentile 20th Percentile 50th Percentile 80th Percentile 90th Percentile
Income Percentiles, Earned Income for Full-Time Workers 25-64 ($2010) CA and Atlanta-Sandy Springs-Marietta, GA Metro Area, 1980 to 2010-2014
Atlanta-Sandy Springs-Marietta, GA Metropolitan Statistical Area United States
Atlanta-Sandy Springs-Marietta, GA Metropolitan Statistical Area Georgia United States
65% 13% 29% 29% 46% 40%
20% 60% 100% 140% Jobs Earnings per worker
Low-wage Med-wage High-wage
3% 8% 6% 5% 7% 13% 8% 6%
3% 5% 5% 7% 13% 8% 6%
13% 40% 27% 19% 19% 16% 36% 47% 20% 24%
8% 30% 25% 19% 14% 11% 29% 46% 19% 20%
Note: Universe is population ages 25+.
Note: Universe is population ages 25+.
Note: Universe is population ages 25+.
Note: Universe is population ages 25+.
Source: http://storage.cloversites.com/northriverside baptistchurch/site_images/sub_page70_picture0.jpg
Image Sources: http://static.guim.co.uk/sys-images/Guardian/Pix/pictures/2009/2/24/1235500211963/Ben-Bernanke-chairman-of--003.jpg; http://blog.usni.org/wp-content/uploads/2010/11/Fed-logo_trans.png; http://www.benjamindrickey.com/gallery/gallery_federal_reserve.jpg
$495.5 $507.0
$485 $490 $495 $500 $505 $510
Actual Projected
GDP ($billions) $0
more workers would be employed
fewer residents would be living in poverty
more in tax revenue to strengthen the social safety net
Need to promote clusters with career ladders, integrating this with neighborhood-based delivery systems, local hiring agreements, and special assistance for those leaving the system of incarceration An overall need to reverse the bias toward highway spending to public transit, from infrastructure to operations. One size does not fit all but transit-oriented development can
Provide real incentives for affordable housing production, and land trusts, work to expand suburban opportunity and acknowledge that the recovery of urban areas requires protection against displacement and gentrification.
Need to consider the financial deserts that result from lack of bank services. “Bank On” programs help banks see the customer base with new data, help customers see the banks with financial literacy, and create systems of accountability. Need to consider the lack of fresh food as well as environmental disparities in both exposures and opportunities. Parks, community gardens, and other access to food security and solace is key to community health.
The toughest nut to crack and yet absolutely essential to retention of families in cities. There may be many different strategies but community leaders cannot stand apart from this without losing the fight for the city.
Realign growth and development strategies to better connect low-income people and places with metro-wide