Light sticks: A Kinetics Demonstration Phenyl oxalate ester + - - PowerPoint PPT Presentation

light sticks a kinetics demonstration
SMART_READER_LITE
LIVE PREVIEW

Light sticks: A Kinetics Demonstration Phenyl oxalate ester + - - PowerPoint PPT Presentation

Light sticks: A Kinetics Demonstration Phenyl oxalate ester + hydrogen peroxide University of Oregon Temperature Relative Amount of Light Relative Reaction Rate Hot water (80C) Room temperature (23C) Cold water (0.0C) Light sticks: A


slide-1
SLIDE 1

Light sticks: A Kinetics Demonstration

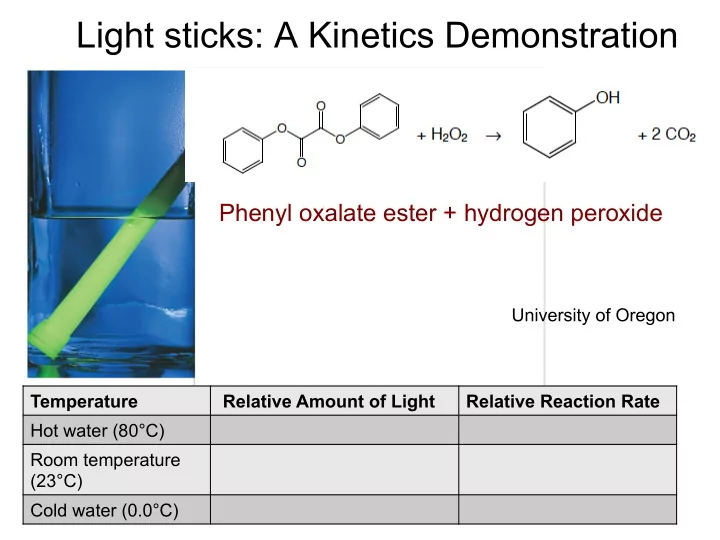
Temperature Relative Amount of Light Relative Reaction Rate Hot water (80°C) Room temperature (23°C) Cold water (0.0°C)

Phenyl oxalate ester + hydrogen peroxide

University of Oregon

slide-2
SLIDE 2

Light sticks: A Kinetics Demonstration

Temperature Relative Amount of Light Relative Reaction Rate Hot water (80°C) Bright Room temperature (23°C) Medium Cold water (0.0°C) Dim

slide-3
SLIDE 3

Temperature and Rate

  • Generally, as temperature

increases, so does the reaction rate.

  • This is, in part, because k is

temperature-dependent.

slide-4
SLIDE 4

Light sticks: A Kinetics Demonstration

Temperature Relative Amount of Light Relative Reaction Rate Hot water (80°C) Bright Fast Room temperature (23°C) Medium Medium Cold water (0.0°C) Dim Slow

slide-5
SLIDE 5

Temperature effects: Consider the humble light stick.

When the temperature increases, the molecular speed __________ . When the molecular speed increases, the number of collisions ________ . Therefore, the rate of reaction __________ when the temperature increases. increases increases increases

light stick mechanism

(always) However, there is more to it than that.

slide-6
SLIDE 6

Gas kinetic rate:

  • At STP, there are 1010 collisions per second.
  • This sets the upper limit for reaction rates.

Why aren’t all reactions over within a fraction of a second? Apparently, not all collisions are effective at leading to a chemical reaction.

slide-7
SLIDE 7

Summary of Light Stick Reaction Mechanism

slide-8
SLIDE 8
slide-9
SLIDE 9

Maxwell–Boltzmann Distributions

  • Temperature is

defined as a measure of the average kinetic energy of the molecules in a sample.

  • At any temperature there is a wide distribution of

molecular speeds of the molecules. There is a distribution of kinetic energies of the molecules.

Minimum energy needed to

  • vercome Ea

T2 > T1 A larger fraction of molecules reacts at a higher temperature.

slide-10
SLIDE 10

Maxwell–Boltzmann Distributions

  • As the temperature increases, the curve broadens.
  • At higher temperatures, a larger population of molecules

has a higher energy and therefore can react.

Minimum energy needed to

  • vercome Ea

T2 > T1 A larger fraction of molecules reacts at a higher temperature.

slide-11
SLIDE 11
slide-12
SLIDE 12

At a higher temperature, the fraction of collisions with sufficient energy equal to or greater than Ea increases. Reaction rate therefore increases. The increase in kinetic energy is the primary reason that reaction rates increase at higher temperatures.

slide-13
SLIDE 13