
SLIDE 1
"Life is like playing a violin in a concert while learning to - - PowerPoint PPT Presentation
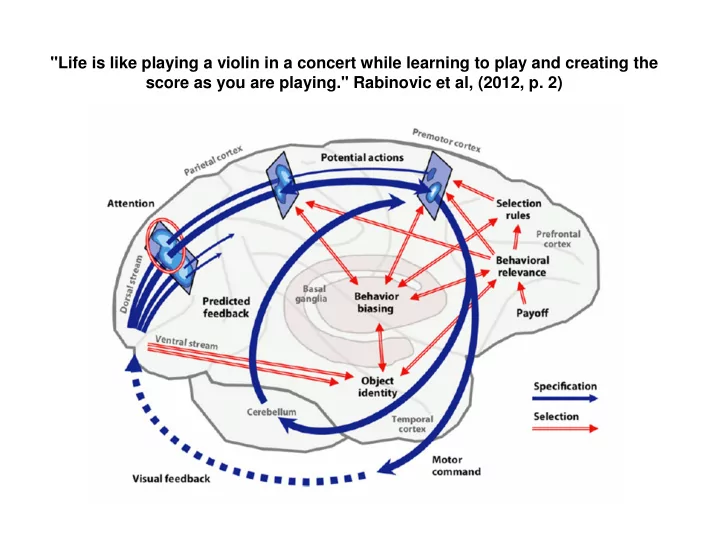
"Life is like playing a violin in a concert while learning to play and creating the score as you are playing." Rabinovic et al, (2012, p. 2) IMPORTANT FACTS 1- Approx. 80% of Neurons are Excitatory & 20% are Inhibitory 2- Pyramidal
Thinking, Planning, Motor execution, Executive Functions, Mood Control
Visual perception & Spatial processing
somatosensory perception integration
language function and auditory perception involved in long term memory and emotion
Short-term memory, attention
Volitional movement, attention, long term memory
attention, long-term memory
ϕ ϕ ϕ ϕ
1 2 3 4 5 6 7 8
1st Derivative of Phase-Difference
00 900
ϕ ϕ ϕ ϕ
Phase difference at
Phase difference at
1 2 3 4 5 6 7 8
1st Derivative of Phase-Difference Negative 1st Derivative Positive 1st Derivative
Phase Shift Duration Fp1-Fp1 Fp1-F3 Fp1-C3 Fp1-P3 Fp1-O1 Fp1-Fp1 Fp1-F3 Fp1-C3 Fp1-P3 Fp1-O1
AGEs (0.44 – 16.22 Years) milliseconds
. 4 4 1 . 6 1 2 . 5 9 3 . 4 9 4 . 4 5 5 . 5 6 . 4 9 7 . 5 2 8 . 4 9 . 5 6 1 . 4 4 1 1 . 4 6 1 2 . 5 2 1 3 . 5 1 1 4 . 4 5 1 5 . 4 5 1 6 . 2 2
40 45 50 55 60 65 70
AGEs (0.44 – 16.22 Years) milliseconds
. 4 4 1 . 6 1 2 . 5 9 3 . 4 9 4 . 4 5 5 . 5 6 . 4 9 7 . 5 2 8 . 4 9 . 5 6 1 . 4 4 1 1 . 4 6 1 2 . 5 2 1 3 . 5 1 1 4 . 4 5 1 5 . 4 5 1 6 . 2 2
40 45 50 55 60 65 70
AGEs (0.44 – 16.22 Years) milliseconds
. 4 4 1 . 6 1 2 . 5 9 3 . 4 9 4 . 4 5 5 . 5 6 . 4 9 7 . 5 2 8 . 4 9 . 5 6 1 . 4 4 1 1 . 4 6 1 2 . 5 2 1 3 . 5 1 1 4 . 4 5 1 5 . 4 5 1 6 . 2 2
40 45 50 55 60 65 70
AGEs (0.44 – 16.22 Years) milliseconds
. 4 4 1 . 6 1 2 . 5 9 3 . 4 9 4 . 4 5 5 . 5 6 . 4 9 7 . 5 2 8 . 4 9 . 5 6 1 . 4 4 1 1 . 4 6 1 2 . 5 2 1 3 . 5 1 1 4 . 4 5 1 5 . 4 5 1 6 . 2 2
40 45 50 55 60 65 70
6 cm 12 cm 18 cm 24 cm
6 cm 12 cm 18 cm 24 cm
AGEs (0.44 – 16.22 Years) milliseconds
. 4 4 1 . 6 1 2 . 5 9 3 . 4 9 4 . 4 5 5 . 5 6 . 4 9 7 . 5 2 8 . 4 9 . 5 6 1 . 4 4 1 1 . 4 6 1 2 . 5 2 1 3 . 5 1 1 4 . 4 5 1 5 . 4 5 1 6 . 2 2
100 150 200 250 300 350 400 450
AGEs (0.44 – 16.22 Years) milliseconds
. 4 4 1 . 6 1 2 . 5 9 3 . 4 9 4 . 4 5 5 . 5 6 . 4 9 7 . 5 2 8 . 4 9 . 5 6 1 . 4 4 1 1 . 4 6 1 2 . 5 2 1 3 . 5 1 1 4 . 4 5 1 5 . 4 5 1 6 . 2 2
100 150 200 250 300 350 400 450
AGEs (0.44 – 16.22 Years) milliseconds
. 4 4 1 . 6 1 2 . 5 9 3 . 4 9 4 . 4 5 5 . 5 6 . 4 9 7 . 5 2 8 . 4 9 . 5 6 1 . 4 4 1 1 . 4 6 1 2 . 5 2 1 3 . 5 1 1 4 . 4 5 1 5 . 4 5 1 6 . 2 2
100 150 200 250 300 350 400 450
AGEs (0.44 – 16.22 Years) milliseconds
. 4 4 1 . 6 1 2 . 5 9 3 . 4 9 4 . 4 5 5 . 5 6 . 4 9 7 . 5 2 8 . 4 9 . 5 6 1 . 4 4 1 1 . 4 6 1 2 . 5 2 1 3 . 5 1 1 4 . 4 5 1 5 . 4 5 1 6 . 2 2
100 150 200 250 300 350 400 450
r = .876 @ p< .01 r = .954 @ p< .0001 r = .868 @ p< .01 r = .874 @ p< .01 r = -.875 @ p< .01 r = -.930 @ p< .001 r = -.895 @ p< .01 r = -.985 @ p< .0001 IQ = 78 + 13.78 x (msec) IQ = 70 +11.85 x (msec) IQ = 75 + 24.45 x (msec) IQ = 68 + 34.40 x (msec) IQ = 143 - 3.11 x (msec) IQ = 142 - 3.36 x (msec) IQ = 132 - 4.57 x (msec) IQ = 140 - 20.08 x (msec)
ef LFP Pr
Θ − Θ = ∆Φ
Msec
46 48 50 52 54 56 58 60 62 DELTA THETA ALPHA1 ALPHA2 BETA1 BETA2 HI-BETA
Autism Normals
NS =.0308 <.0001 =.0299 NS =.0060 NS T-Tests (p):
Msec
100 200 300 400 500 600 700 DELTA THETA ALPHA1 ALPHA2 BETA1 BETA2 HI-BETA
Autism Normals
<.0001 <.0048 NS <.0001 <.0001 NS =.0002 T-Tests (p):
Msec
52 54 56 58 60 62 64 66 DELTA THETA ALPHA1 ALPHA2 BETA1 BETA2 HI-BETA
Autism Normals
=.0487 =.0120 <.0001 =.0053 <.0001 <.0001 =.0360 T-Tests (p):
Msec
100 150 200 250 300 350 400 450 500 DELTA THETA ALPHA1 ALPHA2 BETA1 BETA2 HI-BETA
Autism Normals
<.0001 NS NS <.0001 <.0001 NS <.0001 T-Tests (p):
0% 5% 10% 15% 20% 25% 30% 200 300 400 500 600 700 800 900 1000 1100 1200
Autism Normals
msec msec
Autism Normals
0% 5% 10% 15% 20% 25% 25 30 35 40 45 50 55 60 65 70 75
msec
Autism Normals
0% 5% 10% 15% 20% 25% 30% 35% 40% 200 300 400 500 600 700 800 900 1000 1100 1200
msec
Autism Normals
0% 5% 10% 15% 20% 25% 30% 25 30 35 40 45 50 55 60 65 70 75
5 10 15 20 25 30 35 40 45 400 500 600 700 800 900 1000 1100 1200 1300
MSEC TOTAL COUNT
AUTISM - ALPHA2 – PHASE LOCK DURATION 6cm INTER-ELECTRODE DISTANCES
0% 5% 10% 15% 20% 25% 30% 35% 40% 45% 50% 20 25 30 35 40 45 50 55 60 65 70 75 80 85 90 95
msec
0% 5% 10% 15% 20% 25% 30% 35% 40% 45% 50% 20 25 30 35 40 45 50 55 60 65 70 75 80 85 90 95
msec
0% 5% 10% 15% 20% 25% 30% 35% 40% 45% 50% 20 25 30 35 40 45 50 55 60 65 70 75 80 85 90 95
msec
0% 5% 10% 15% 20% 25% 30% 35% 40% 45% 50% 20 25 30 35 40 45 50 55 60 65 70 75 80 85 90 95
msec
Brodmann Areas (8 & 9) Left Brodmann Areas (30 & 31) Left Brodmann Areas (36 & 39) Left
Eyes Closed Eyes Opened
Brodmann Areas (8 & 9) Left Brodmann Areas (23 & 30) Left Brodmann Areas (9 & 39) Left Brodmann Areas (28 & 36) Left Brodmann Areas (30 & 31) Left Brodmann Areas (24 & 29) Left Brodmann Areas (8 & 9) Right Brodmann Areas (23 & 39) Right Brodmann Areas (31 & 32) Right
0% 10% 20% 30% 40% 50% 60% 70% 80% 90% 100% 100 200 300 400 500 600 700 800 900 0% 10% 20% 30% 40% 50% 60% 70% 80% 90% 100% 100 200 300 400 500 600 700 800 900 0% 10% 20% 30% 40% 50% 60% 70% 80% 90% 100% 100 200 300 400 500 600 700 800 900 0% 10% 20% 30% 40% 50% 60% 70% 80% 90% 100% 100 200 300 400 500 600 700 800 900
Eyes Closed Eyes Opened
Brodmann Areas (8 & 10) Right Brodmann Areas (21 & 36) Right
Brodmann Areas (8 & 40) Right Brodmann Areas (21 & 36) Right
msec msec
Brodmann Areas (28 & 32) Right Brodmann Areas (28 & 30) Right
msec
Brodmann Areas (9 & 30) Right Brodmann Areas (24 & 32) Right
msec
Distance (mm)
Shift Group Means (msec) Distance (mm)
R = .633; p <= .0001
Distance (mm)
Lock Group Means (msec) Distance (mm)
R = -.505; p <= .0001
Shift Group Means (msec) Distance (mm)
R = .491; p = .0027
Lock Group Means (msec) Distance (mm)
R = -.379; p = .0249
0% 5% 10% 15% 20% 25% 30% 35% 40% 45% 50% 20 25 30 35 40 45 50 55 60 65 70 75 80 85 90 95
msec
Brodmann Areas (8 & 9) Left Brodmann Areas (30 & 31) Left Brodmann Areas (36 & 39) Left
Eyes Closed Eyes Opened
10 20 30 40 50 60 70 80 90 100 110 120 130 140 200 400 600 800 1000 25 35 45 55 65
Euclidean Distance Between Brodmann Areas (mm) msec
Gap = 135 msec
Frequency 0 – 40 Hz uV Frequency 0 – 40 Hz Equilibration Ratio
0.000 0.100 0.200 0.300 0.400 0.500 0.600 0.700 0.800 0.900 1.000 Delta Theta Alpha Beta Correlation Coefficient
0.000 0.100 0.200 0.300 0.400 0.500 0.600 0.700 0.800 0.900 1.000 Delta Theta Alpha Beta Correlation Coefficient
0.000 0.100 0.200 0.300 0.400 0.500 0.600 0.700 0.800 0.900 1.000 Delta Theta Alpha Beta Correlation Coefficient
0.000 0.100 0.200 0.300 0.400 0.500 0.600 0.700 0.800 0.900 1.000 Delta Theta Alpha Beta Correlation Coefficient
0.1 0.2 0.3 0.4 0.5
1 3 5
VERB IQ <= 90 VERB IQ >= 120 90 < VERB IQ < 120 EEG Discriminant Scores
N = 95 N = 270 N = 77
PROPORTION PER POPULATION
0.1 0.2 0.3 0.4
1 3 5
PERF IQ <= 90 PERF IQ >= 120 90 < PERF IQ < 120 EEG Discriminant Scores
N = 67 N = 302 N = 73
PROPORTION PER POPULATION
0.1 0.2 0.3 0.4 0.5
1 3 5
PROPORTION PER POPULATION EEG Discriminant Scores FULL IQ <= 90 FULL IQ >= 120 90 < FULL IQ < 120
N = 97 N = 267 N = 70
M ultiple R egressions of Q E E G w ith FU LL IQ
0.000 0.100 0.200 0.300 0.400 0.500 0.600 0.700 0.800 0.900 1.000 P hase D ifference C
hase R eset per S econd P hase R eset Locking Interval M eans A m plitude A sym m etry P hase R eset D uration M eans B urst A m plitude M eans abs(O U T- P H A S E ) C ross S pectral P
er abs(IN
H A S E ) A bsolute P
er P hase R eset A m plitude M eans P eak Frequency Q E E G ME A S U R E MULTIPLE
Ordinal or Nominal measure Reward Strength (R) Feedback signal time locked to E (msec) Contingency of Reward Signal (S) Time preceding/following E (msec – sec) Contiguity Window (C) Z Scores and Brodmann areas linked to symptoms Specificity of EEG Event (E)