LEGISLATIVE OVERSIGHT COMMISSION ON EDUCATION ACCOUNTABILITY Senate - - PDF document

legislative oversight commission on education
SMART_READER_LITE
LIVE PREVIEW

LEGISLATIVE OVERSIGHT COMMISSION ON EDUCATION ACCOUNTABILITY Senate - - PDF document

LEGISLATIVE OVERSIGHT COMMISSION ON EDUCATION ACCOUNTABILITY Senate Finance Committee Room January 11, 2015 Reauthorization Report: Baccalaureate and Associate Degree Granting Institutions 1 18B-4-7 Dr. Corley Dennison, Vice Chancellor


slide-1
SLIDE 1

LEGISLATIVE OVERSIGHT COMMISSION ON EDUCATION ACCOUNTABILITY

Senate Finance Committee Room January 11, 2015

 Reauthorization Report: Baccalaureate and Associate Degree Granting Institutions 1 §18B-4-7

  • Dr. Corley Dennison, Vice Chancellor for Academic Affairs

 Annual Personnel Report 7 §18B-7-8

  • Ms. Trish Clay, Vice Chancellor for Human Resources

 2014 System Performance Report 21 §18B-1B-4

  • Dr. Paul Hill, Chancellor, West Virginia Higher Education Policy Commission

 West Virginia Higher Education Report Card 29 §18B-1D-8

  • Dr. Neal Holly, Interim Vice Chancellor for Policy and Planning

 West Virginia Health Sciences and Rural Health Report Card §18B-16-9

  • Dr. Robert Walker, Vice Chancellor for Health Sciences

 Capital Project Priorities 35 §18B-19-5

  • Dr. Edward Magee, Vice Chancellor for Finance

 Developmental Education Programs Joint Report 41

  • Dr. Neal Holly, Interim Vice Chancellor for Policy and Planning
slide-2
SLIDE 2
slide-3
SLIDE 3

MEMORANDUM TO: Legislative Oversight Commission on Education Accountability FROM: Paul L. Hill James L. Skidmore DATE: January 11, 2015 RE: Reauthorization Report: Baccalaureate and Associate Degree Granting Institutions Senate Bill 375, passed during the 2011 Legislative Session delegated responsibility and authority for establishing, monitoring, and maintaining quality standards of all higher education institutions within West Virginia to the West Virginia Higher Education Policy Commission (Commission) and the West Virginia Council for Community and Technical College Education (Council). The annual reporting requirements outlined in Series 52, Legislative Rule, Annual Reauthorization of Degree Granting Institutions, requires each institution to provide all information necessary to assess the performance of the institutions and to determine whether the institution continues to meet the “minimum standards for conferring degrees.” Information collected in the annual reauthorization “application report” includes, accreditation status, student enrollment data, tuition and fee information, retention rates (first to second year), graduation rates, student loan default rates and campus crime statistics (chart display-attached). Information is also collected on licensure pass rates, student transfer numbers and student, staff and faculty grievance numbers. The first submission of institutional reauthorization data was received on November 1, 2013 and was reviewed by compliance review teams, one for baccalaureate institutions and one for associate/certificate institutions. In some cases, additional information was requested to clarify or correct data that was submitted. Once the reviews were completed, the team members sent a recommendation to the Commission and Council for approval.

West Virginia Higher Education Policy Commission West Virginia Community and Technical College System

1018 Kanawha Boulevard, East, Suite 700 Charleston, West Virginia 25301

Paul L. Hill, Ph.D.

Chancellor

Bruce L. Berry, M.D.

Chair

James L. Skidmore

Chancellor

Clarence “Butch” Pennington

Chair (304) 558-2101 www.hepc.wvnet.edu www.wvctcs.org

1

slide-4
SLIDE 4

Baccalaureate Institutions During the April 25, 2014 Commission meeting, the following baccalaureate institutions were approved for annual reauthorization to operate within West Virginia: Public: Bluefield State College, Concord University, Fairmont State University, Glenville Sate College, Shepherd University, West Liberty University and West Virginia State University Private: Alderson Broaddus College, Appalachian Bible College, Bethany College, Davis and Elkins College, University of Charleston, West Virginia Wesleyan College, and Wheeling Jesuit University Proprietary: American Public University and Strayer University Marshall University and West Virginia University are exempt from the annual reauthorization component of this legislative mandate. However, both institutions are required to submit annual reauthorization data for review and publication. The Commission delayed reauthorization for three institutions: One proprietary school, Salem International University and two private institutions, Ohio Valley University and Future Generations Graduate School. Future Generations is an institution with a non-traditional curriculum and Commissioners requested additional information on the quality and integrity of the academic program and its courses and documentation that illustrated the financial stability of the institution. Commissioners approved reauthorization at the meeting of August 1, 2014. Ohio Valley University was subject to a financial focus visit from the Higher Learning Commission (HLC) in December 2011. HLC review team members concluded the institution was out of compliance with several criteria for accreditation and recommended monitoring rather than sanctions as the University was preparing a ten-year comprehensive review. Citing ten areas

  • f concern, the HLC Board of Trustees imposed a sanction of probation in February of 2012.

Based on the University’s response to those concerns, the HLC removed the sanction of probation in October of 2013. However, continuing challenges were cited in assessment, finances, faculty and staff evaluation, associate degree programs, general education and program

  • review. With the HLC action of removing sanctions, the HEPC Compliance Review Team

recommended reauthorization and the Commission approved at the meeting of August 1, 2014. The HLC Board of Trustees notified Salem International University in February 2014 that it had met the Criteria for Accreditation. However, the HLC expressed concerns about the University’s ability to remain in compliance with the criteria in the future. These concerns led Salem International to be placed on notice; a public status signifying an accredited institution is at risk

  • f being out of compliance with one or more of the Criteria for Accreditation and Core

2

slide-5
SLIDE 5
  • Components. HLC evaluators scheduled a focused visit for September 2014. Based on that

information, Commissioners delayed reauthorization at both the April and August meetings. HLC evaluators on the focused visit in September of 2014 found no evidence that continuation

  • f the sanctions were warranted and recommended that no follow up was needed. However, a

copy of the formal report was not available in time for the Commission meeting of November 21, 2014. Therefore, formal reauthorization was again delayed pending the arrival of the formal report from the HLC. Associate/Certificate Institutions At the meeting of April 24, 2014, the Council approved reauthorization for the following associate/certificate institutions: Public: Blue Ridge Community and Technical College, Bridgemont Community and Technical College (now BridgeValley), Eastern West Virginia Community and Technical College, Kanawha Valley Community and Technical College (now BridgeValley), Mountwest Community and Technical College, New River Community and Technical College, Pierpont Community and Technical College, Southern West Virginia Community and Technical College, West Virginia Northern Community College, and West Virginia University at Parkersburg. Private/Proprietary: American National University, Everest Institute, Huntington Junior College, ITT Technical Institute, Mountain State College, Ross Education-LLC, Valley College of Technology (Martinsburg), Valley College of Technology (Princeton), Valley College of Technology (Beckley), West Virginia Business College Inc., West Virginia Junior College (Morgantown), and West Virginia Junior College (Charleston, Bridgeport).

3

slide-6
SLIDE 6

2013 Reauthorization Data:

Institutions Institution Type Accreditation Status Last Accreditation Date Annualized Unduplicated Headcount Tuition/Fees Retention Rate Bachelor Graduation Rate Loan Default Rate Illegal Weapons Drug Law Violation Liquor Law Violation Murder Negligent Manslaughter Sex Offence Forcible Sex Offence Non‐ Forcible Robbery Aggravated Assault Burglary Motor Vehicle Theft Arson Hate Crimes PUBLIC: Bluefield State College Public Accredited 2/21/2012 2,394 5,564 $

53.3 18.1 23.5

Concord University Public Accredited 9/4/2008 3,792 5,874 $

62 38 19

6 5 1 6 Fairmont State University Public Accredited 5/13/2013 5,306 5,496 $

64 36 18

4 60 61 1 2 9 2 Glenville State College Public Accredited 8/13/2013 2,269 6,384 $

52 27 23.9

1 11 22 1 7 13 3 Marshall University Public Accredited 1/28/2006 17,608 6,216 $

71 44 13.6

42 38 1 1 4 1 Shepherd University Public Accredited 6/20/2012 5,229 6,256 $

63 38 10.7

6 11 9 1 3 1 West Liberty University Public Accredited 9/4/2008 2,963 5,266 $

71 41 14.5

5 15 2 1 3 West Virginia School of Osteopathic Medicine Public Accredited 5/20/2009 837 20,950 $

96.5 N/A 0.6

West Virginia State University Public Accredited 8/26/2005 3,238 5,442 $

51.1 21 10.1

2 3 3 1 1 7 2 West Virginia University Public Accredited 8/27/2004 33,476 6,090 $

77 56 9.8

1 208 444 2 4 2 39 1 Potomac State College of WVU Public Accredited 4/16/2004 2,068 3,178 $

46 N/A 9.8

45 122 3 8 1 WVU Institute of Technology Public Accredited 4/16/2004 1,340 5,558 $

45 24 9.8

1 2 2 PRIVATE: Alderson‐Broaddus College Private Accredited 8/6/2013 949 22,740 $

66 46 12.1

5 5 23 2 2 2 1 Appalachian Bible College Private Accredited 6/2/2001 329 19,634 $

78 47 4.5

Bethany College Private Accredited 6/25/2009 1,074 24,780 $

64 46.5 12.6

1 24 27 3 2 26 4 1 Davis & Elkins College Private Accredited 4/28/2011 925 24,992 $

61 38 10

8 14 1 1 Future Generations Graduate School Private Accredited 2/26/2010 40 17,500 $

0.9

Ohio Valley University Private *Accredited 1/1/2001 554 18,750 $

49 44 8.9

4 7 1 University of Charleston Private Accredited 1/1/2005 2,238 19,650 $

70 46 14.9

1 5 1 3 West Virginia Wesleyan College Private Accredited 4/29/2010 1,492 26,794 $

64 58 10.2

7 1 9 1 Wheeling Jesuit University Private Accredited 9/17/2009 2,076 27,830 $

74.5 53.3 6.6

7 164 2 3 13 FOR‐PROFIT: American‐Public University System For‐Profit Accredited 5/22/2006 116,779 6,400 $

93.8 20 11.9

Salem International University For‐Profit *Accredited 8/28/2006 1,356 14,160 $

44 32 15.7

3 16 2 8 Strayer University For‐Profit Accredited 6/30/2007 423 15,495 $

N/A N/A 15.2

CRIME STATISTICS

*Ohio Valley University is required to host a focused visit in fall 2014 on finances, assessment, the Institutional Review Board, faculty and staff evaluation, the associate's degree program, the general education program, and program review. The University will host its next evaluation for Reaffirmation of Accreditation in 2016. *Salem International University has been placed on Notice by the Higher Learning Commission. The University is required to file a Notice Report in June 2014 providing evidence that the University has resolved the concerns of the Board identified in the Notice action and evidence that the University meets the Criteria for Accreditation and Core Components identified in this action as being at risk of not being met. The University will host a focused visit in September 2014, focused on validating the contents of the Notice Report. At its meeting in February 2015, the Higher Learning Commission Board will review materials related to this evaluation and determine whether the University can be removed from Notice.

4

slide-7
SLIDE 7

2013 Reauthorization Data:

Institutions Institution Type Accreditation Status Last Accreditation Date Annualized Unduplicated Headcount Tuition/Fees Retention Rate Associates Graduation Rate Loan Default Rate Illegal Weapons Drug Law Violation Liquor Law Violation Murder Negligent Manslaughter Sex Offence Forcible Sex Offence Non‐ Forcible Robbery Aggravated Assault Burglary Motor Vehicle Theft Arson Hate Crimes PUBLIC: Blue Ridge Community and Technical College Public Accredited 2/17/2010 5,852 3,120 $

49.7 23.8 22.9

Bridgemont Community and Technical College Public Accredited 4/1/2004 1,292 3,834 $

50 27.5 24.1

2 Eastern WV Community and Technical College Public Accredited 10/8/2008 1,114 2,688 $

64 12.9

Kanawha Valley Community and Technical College Public Accredited 6/10/2010 2,072 3,236 $

49.1 9.4 18.2

3 Mountwest Community and Technical College Public Accredited 7/3/2008 4,073 2,952 $

26.2 7.5 32.1

10 17 1 1 3 1 New River Community and Technical College Public Accredited 2/8/2008 4,172 3,676 $

40.1 6.2 31.7

4 Pierpont Community and Technical College Public Accredited 4/28/2008 3,998 4,150 $

36.1 9 29.2

6 13 1 2 9 2 Southern West Virginia Community and Technical College Public Accredited 9/24/2013 2,745 3,124 $

48 7.1 23

3 West Virginia Northern Community College Public Accredited 8/13/2013 3,776 1,690 $

47 10 31.7

5 West Virginia University at Parkersburg Public Accredited 1/1/2001 5,780 1,356 $

67 35 23.1

1 1 PROPRIETARY: American National University Proprietary Accredited 8/16/2010 398 11,544 $

33.3 20 10.7

2 Everest Institute Proprietary Accredited* 8/1/2011 370 18,700 $

65 44 19

Huntington Junior College Proprietary Accredited 9/1/2012 1,225 7,485 $

37 32 28.4

1 ITT Technical Institute Proprietary Accredited 4/30/2013 557 24,566 $

61 23 14.4

Mountain State College Proprietary Accredited 12/31/2013 208 8,210 $

75 75 8.7

Ross Education, LLC Proprietary Accredited 3/8/2012 162 15,790 $

76

Valley College of Technology‐ Martinsburg Proprietary Accredited 4/11/2011 102 15,075 $

80 20.2

Valley College of Technology‐Princeton Proprietary Accredited 8/29/2012 127 15,575 $

67 56.5

Valley College of Technology‐Beckley Proprietary Accredited 4/29/2013 307 15,575 $ 60 66 36.9 West Virginia Business College Inc Proprietary Accredited 4/1/2007 169 9,700 $ 70 70 12.2 West Virginia Junior College‐ Morgantown Proprietary Accredited 8/23/2010 330 12,650 $

75 70 2.9

West Virginia Junior College‐ Charleston/Bridgeport Proprietary Accredited 1/1/2010 723 12,650 $

70.5 65.1 5.8

CRIME STATISTICS

*Through an agreement with the U.S. Department of Education, Corinthian Colleges, Incorporated will close its Everest Institute location in Cross Lanes, WV

5

slide-8
SLIDE 8

6

slide-9
SLIDE 9

Report to the Legislative Oversight Commission

  • n Education Accountability

January 11, 2015 2014 Annual Personnel Report

7

slide-10
SLIDE 10

8

slide-11
SLIDE 11

MEMORANDUM TO: Legislative Oversight Commission on Education Accountability FROM: Paul L. Hill James L. Skidmore DATE: January 11, 2015 RE: 2014 Annual Personnel Report The 2014 Annual Personnel Report as required by West Virginia Code §18B-7-8(b)(1) for the West Virginia Higher Education Policy Commission (Commission) and West Virginia Council for Community and Technical College Education (Council) is attached. The report includes progress made by organizations toward achieving full funding of the Temporary Classified Employees’ Salary Schedule as required by West Virginia Code §18B-7-8(b)(1)(A). As defined in West Virginia Code §18B-9-3, an organization has achieved full funding of the Temporary Classified Employees’ Salary Schedule when it provides, in total, one hundred percent of the funds needed to meet the salary funding target as calculated in October 2010. Institutions are required to make “adequate progress” in achieving full funding as described in the following schedule: For Commission institutions, “adequate progress” is defined as reaching a proportional level of the shortfall in funding by certain target dates as listed below:

  • 25% of the deficit by July 1, 2012
  • 50% of the deficit by July 1, 2013
  • 75% of the deficit by July 1, 2014
  • 100% of the deficit by July 1, 2015

For Council institutions, “adequate progress” is defined as reaching a proportional level of the shortfall in funding by certain target dates as listed below:

  • 25% of the deficit by July 1, 2013
  • 50% of the deficit by July 1, 2014

West Virginia Higher Education Policy Commission West Virginia Community and Technical College System

1018 Kanawha Boulevard, East, Suite 700 Charleston, West Virginia 25301

Paul L. Hill, Ph.D.

Chancellor

Bruce L. Berry, M.D.

Chair

James L. Skidmore

Chancellor

Clarence “Butch” Pennington

Chair (304) 558-2101 www.hepc.wvnet.edu www.wvctcs.org

9

slide-12
SLIDE 12
  • 75% of the deficit by July 1, 2015
  • 100% of the deficit by July 1, 2016

The Commission and Council expected that implementation of the WVOASIS HRM/Payroll System would provide the structure, uniformity, and technology necessary to compile Human Resources Metrics for the Human Resources Report Card required by West Virginia Code §18B- 7-8(b)(2) (A) through (F). However, the system is not yet functional nor does it support the data elements required for higher education human resources reporting requirements. Elements of the Human Resources Metrics Report Card are included in the Annual Personnel Report along with

  • ther pertinent data elements that provide indications of consistent application of personnel

policy. An analysis of the report follows below. West Virginia Higher Education Policy Commission  Of the 10 Commission organizations: Three have non-classified FTE percentages below the 7/1/15 goal of 20%. Four are between 20 and 25% and in compliance with the 7/1/13 goal. Three are less than 1% above the 25% goal for 7/1/13. All organizations are working to reduce the FTE percentage on non-classified employees to be in compliance by July 1, 2015.  Organizational salary increases as a percentage of base for Commission organizations ranged from a low of 1.10% at West Virginia University to a high of 4.41% at Marshall University.  The average salary per employee at Commission organizations ranged from a low of $40,797 at West Virginia State University to a high of $67,890 at the West Virginia School

  • f Osteopathic Medicine.

 The average salary increase for faculty promotion in rank at Commission organizations ranged from a low of $2,643 at West Liberty University to a high of $11,992 at the West Virginia School of Osteopathic Medicine.  Glenville State College is the only Commission organization that has not yet fully funded the October 2010 Temporary Classified Employees’ Salary Schedule nor at current service levels. West Virginia Council for Community and Technical College Education  Of the nine Council organizations: Three have non-classified FTE percentages below the 7/1/15 goal of 20%. Four are between 20 and 25% and in compliance with the 7/1/13 goal. Two are above the 25% goal for 7/1/13. All organizations are working to reduce the FTE percentage on non-classified employees to be in compliance by July 1, 2015.

10

slide-13
SLIDE 13

 Organizational salary increases as a percentage of base for Council organizations ranged from a low of 1.56% at Southern West Virginia Community and Technical College to a high

  • f 3.22% at BridgeValley Community and Technical College.

 The average salary per employee at Council organizations ranged from a low of $41,541 at Southern West Virginia Community and Technical College to a high of $49,948 at Pierpont Community and Technical College.  The average salary increase for faculty promotion in rank at Council organizations ranged from a low of $3,379 at Eastern West Virginia Community and Technical College to a high

  • f $8,275 at the BlueRidge Community and Technical College. (BlueRidge noted that

faculty who received promotions also received regular salary increases as well. West Virginia Northern had no faculty promotions reported.)  All Council organizations have fully funded the Temporary Classified Employees’ Salary Schedule as of October 2010. Three Council organizations have not yet fully funded the salary schedule at current levels of service.

11

slide-14
SLIDE 14

Annual Personnel Report 2014

West Virginia Higher Education Policy Commission ‐ FY 2015 Report of Institutional Salary Increases and Non‐Classified Percentages Faculty Classified Non‐Classified Institutional Totals Faculty Classified Non‐Classified Institutional Totals Faculty Classified Non‐Classified Institutional Totals Number of Benefit Eligible Employees (FTE => .53) per Category ‐ Headcount 77 94 24 195 124 115 35 274 148 159 68 375 Number of Benefit Eligible Employees (FTE => .53) per Category ‐ FTE 77.00 93.83 24.00 194.83 123.00 114.00 35.00 272 148.00 156.91 65.72 370.63 Number of Part‐Time Regular (Excluding Adjunct Faculty) Employees (FTE < .53) per Category ‐ Headcount 1.00 1 1.00 1.00 0.00 2 0.00 26.00 2.00 28 Number of Part‐Time Regular (Excluding Adjunct Faculty) Employees (FTE < .53) per Category ‐ FTE 0.30 0.3 0.48 0.50 0.00 0.98 11.82 1.02 12.84 Number of Benefit Eligible Athletic Coaches included each Employee Category‐ Headcount 3 3 12 12 12 12 Number of Benefit Eligible Athletic Coaches included each Employee Category ‐ FTE 3.00 3 0.00 0.00 12.00 12 0.00 0.00 11.66 11.66 Total Base Salary Amount at end of FY 2013‐2014 (i.e. as of 6/30/14) $4,308,168 $3,399,540 $1,688,732 $9,396,440 $2,477,201 $6,500,303 $4,300,417 $13,277,921 $9,131,786 $5,334,487 $4,634,714 $19,100,987 Total Dollars Utilized for Salary Increases (excluding benefit costs) on or after July 1, 2014 ‐ Include all faculty increases EXCEPT increases for promotion in rank. Report faculty promotion in rank increases on the next line. $38,808 $176,276 $12,096 $227,180 $62,496 $108,960 $17,640 $189,096 $148,008 $185,811 $69,042 $402,861 Total Dollars Utilized for Faculty Promotions in Rank (excluding benefit costs) $23,940 $23,940 $28,513 $28,513 $53,184 $53,184 Total Dollar Amount of Salary Increases Provided by Category $62,748 $176,276 $12,096 $251,120 $91,009 $108,960 $17,640 $217,609 $201,192 $185,811 $69,042 $456,045 Total Base Salary Amount After FY 2014‐2015 Salary Increases. FY 2014 Total Base Salary plus Total Dollars Utilized for Salary Increase plus Total Dollars Utilized for Faculty Promotions in Rank. $4,370,916 $3,575,816 $1,700,828 $9,647,560 $2,568,210 $6,609,263 $4,318,057 $13,495,530 $9,332,978 $5,520,298 $4,703,756 $19,557,032 Number of Faculty Receiving Promotion in Rank Increases ‐ FTE 4 4 5 5 8 8 Total Number of Employees Receiving Salary Increases including faculty promotions in rank ‐ Headcount 77 95 24 196 123 114 35 272 156 159 68 383 Total Number of Employees Receiving Salary Increases including faculty promotions in rank ‐ FTE 77.00 94.13 24.00 195.13 124.00 115.00 35.00 274.00 156.00 156.91 66.77 379.68 Average Amount of Increases per Employee FTE excluding Faculty Promotion in Rank $532 $1,873 $504 $1,189 $525 $947 $504 $703 $1,000 $1,184 $1,034 $1,084 Salary Increases as Percentage of Base Salary 1.46% 5.19% 0.72% 2.67% 3.67% 1.68% 0.41% 1.64% 2.20% 3.48% 1.49% 2.39% Average Amount of Increase for Faculty Promotion in Rank $5,985 $5,985 $5,703 $5,703 $6,648 $6,648 Average Employee Salary per Category after 2015 Salary Increase $56,765 $37,988 $70,868 $49,442 $20,799 $57,723 $123,373 $49,438 $63,061 $32,717 $70,479 $51,000

Fairmont State University Bluefield State College Concord University

WV Code §18B‐9‐3 Temporary Classified Employee Salary Schedule ‐ Percent of Full Funding (as of October 2014 ‐with current service years) 100.00% 100.00% 100.00% Amount needed to be fully funded as of October 1, 2014 $0 $0 $0 WV Code §18B‐9‐3 Temporary Classified Employee Salary Schedule Percent of Full Funding (using service as of October 2010) 100.00% 100.00% 100.00% Number of Classified Employees Paid Below Step ‐ Headcount 0.00 0.00 0.00 Number of Classified Employees Paid Above Step ‐ Headcount 0.00 57.00 Number of Classified Employees Paid Above Step Receiving Increases ‐ Headcount 0.00 57.00 Effective Date (or Proposed Effective Date) of Increases 07/01/14 07/01/14 07/01/14 08/15/14 07/01/14 07/01/14 07/01/14 07/01/14 07/01/14 Date of Board of Governors' Approval prior to July 1, 2014 prior to July 1, 2014 prior to July 1, 2014 05/15/14 05/15/14 05/15/14 Is your institution administering compensation using the Temporary Classified Employee Salary Schedule published in WV Code §18B‐9‐3? Yes, Modified Yes Yes If not, what year did you begin using a modified version of the classified employee salary structure? 2015 N/A Provide Notes or Explanations here: §18B‐7‐11 Employees Designated as Non‐classified Non‐classified FTE Percentage Non‐classified FTE Percentage Non‐classified FTE Percentage 20% NC Goal Calculation: (FTE of Retirement program eligible classified employees less FTE retirement program eligible classified athletic coaches) plus (FTE of retirement program eligible Non‐classified employees less FTE retirement program eligible Non‐classified athletic coaches) times .20 = July 1, 2015 Goal for FTE number of non‐classified employees 22.97 20.00% 7/1/15 Goal 27.40 20.00% 7/1/15 Goal 42.19 20.00% 7/1/15 Goal Current retirement program eligible FTE number of non‐classified employees less FTE retirement program eligible non‐classified athletic coaches 21.00 18.29% Current 23.00 16.79% Current 54.06 25.62% Current Modified version of the classified employee salary structure includes Step

  • 16. 2015 was the first year salary increases were granted within the past

several years.

12

slide-15
SLIDE 15

Annual Personnel Report 2014

West Virginia Higher Education Policy Commission ‐ FY 2015 Report of Institutional Salary Increases and Non‐Classified Percentages Number of Benefit Eligible Employees (FTE => .53) per Category ‐ Headcount Number of Benefit Eligible Employees (FTE => .53) per Category ‐ FTE Number of Part‐Time Regular (Excluding Adjunct Faculty) Employees (FTE < .53) per Category ‐ Headcount Number of Part‐Time Regular (Excluding Adjunct Faculty) Employees (FTE < .53) per Category ‐ FTE Number of Benefit Eligible Athletic Coaches included each Employee Category‐ Headcount Number of Benefit Eligible Athletic Coaches included each Employee Category ‐ FTE Total Base Salary Amount at end of FY 2013‐2014 (i.e. as of 6/30/14) Total Dollars Utilized for Salary Increases (excluding benefit costs) on or after July 1, 2014 ‐ Include all faculty increases EXCEPT increases for promotion in rank. Report faculty promotion in rank increases on the next line. Total Dollars Utilized for Faculty Promotions in Rank (excluding benefit costs) Total Dollar Amount of Salary Increases Provided by Category Total Base Salary Amount After FY 2014‐2015 Salary Increases. FY 2014 Total Base Salary plus Total Dollars Utilized for Salary Increase plus Total Dollars Utilized for Faculty Promotions in Rank. Number of Faculty Receiving Promotion in Rank Increases ‐ FTE Total Number of Employees Receiving Salary Increases including faculty promotions in rank ‐ Headcount Total Number of Employees Receiving Salary Increases including faculty promotions in rank ‐ FTE Average Amount of Increases per Employee FTE excluding Faculty Promotion in Rank Salary Increases as Percentage of Base Salary Average Amount of Increase for Faculty Promotion in Rank Average Employee Salary per Category after 2015 Salary Increase Faculty Classified Non‐Classified Institutional Totals Faculty Classified Non‐Classified Institutional Totals Faculty Classified Non‐Classified Institutional Totals 69 96 39 204 821 638 206 1,665 166 214 64 444 69.00 95.35 38.34 202.69 813.02 636.08 204.26 1653.36 166.00 205.21 63.32 434.53 0.00 0.00 22.00 22 14.00 0.00 0.00 14 0.00 70.00 0.00 70 0.00 0.00 11.44 11.44 3.53 0.00 0.00 3.53 0.00 16.00 0.00 16 1 10 11 39 3 42 12 3 15 1.00 9.76 10.76 38.58 3.00 41.58 12.00 0.00 2.49 14.49 $3,734,546 $3,159,792 $2,481,331 $9,375,669 $57,163,438 $20,877,826 $13,569,950 $91,611,214 $9,482,873 $6,846,808 $4,530,000 $20,859,681 $35,136 $52,864 $24,846 $112,846 $2,164,134 $889,586 $693,007 $3,746,727 $167,243 $104,600 $64,000 $335,843 $20,088 $20,088 $291,092 $291,092 $23,300 $23,300 $55,224 $52,864 $24,846 $132,934 $2,455,226 $889,586 $693,007 $4,037,819 $190,543 $104,600 $64,000 $359,143 $3,789,770 $3,212,656 $2,506,177 $9,508,603 $59,618,664 $21,767,412 $14,262,957 $95,649,033 $9,673,416 $6,951,408 $4,594,000 $21,218,824 4 4 42 42 4 4 69 96 39 204 754 607 184 1545 166 240 58 464 69.00 95.35 38.34 202.69 745.98 605.68 182.43 1,534.09 166.00 208.00 58.00 432.00 $541 $554 $648 $568 $3,074 $1,469 $3,799 $2,511 $1,032 $503 $1,103 $785 1.48% 1.67% 1.00% 1.42% 4.30% 4.26% 5.11% 4.41% 2.01% 1.53% 1.41% 1.72% $5,022 $5,022 $6,931 $6,931 $5,825 $5,825 $54,924 $33,693 $50,345 $44,406 $73,013 $34,221 $69,827 $57,728 $58,274 $31,424 $72,552 $47,097

Shepherd University Glenville State College Marshall University

WV Code §18B‐9‐3 Temporary Classified Employee Salary Schedule ‐ Percent of Full Funding (as of October 2014 ‐with current service years) Amount needed to be fully funded as of October 1, 2014 WV Code §18B‐9‐3 Temporary Classified Employee Salary Schedule Percent of Full Funding (using service as of October 2010) Number of Classified Employees Paid Below Step ‐ Headcount Number of Classified Employees Paid Above Step ‐ Headcount Number of Classified Employees Paid Above Step Receiving Increases ‐ Headcount Effective Date (or Proposed Effective Date) of Increases Date of Board of Governors' Approval Is your institution administering compensation using the Temporary Classified Employee Salary Schedule published in WV Code §18B‐9‐3? If not, what year did you begin using a modified version of the classified employee salary structure? Provide Notes or Explanations here: §18B‐7‐11 Employees Designated as Non‐classified 20% NC Goal Calculation: (FTE of Retirement program eligible classified employees less FTE retirement program eligible classified athletic coaches) plus (FTE of retirement program eligible Non‐classified employees less FTE retirement program eligible Non‐classified athletic coaches) times .20 = July 1, 2015 Goal for FTE number of non‐classified employees Current retirement program eligible FTE number of non‐classified employees less FTE retirement program eligible non‐classified athletic coaches 98.24% 100.00% 103.17% $57,034 $0 93.08% 100.00% 57.00 0.00 98.00 36.00 246.00 115.00 36.00 394.00 103.00 07/01/14 07/01/14 07/01/14 7/1/14 and 10/1/14 7/1/14 and 10/1/14 7/1/14 and 10/1/14 07/01/14 07/01/14 07/01/14 4/23/14 and 9/3/14 4/23/14 and 9/3/14 4/23/14 and 9/3/14 06/05/14 06/05/14 06/05/14 Yes Yes partially 10/1/2008 Non‐classified FTE Percentage Non‐classified FTE Percentage Non‐classified FTE Percentage 24.79 20.00% 7/1/15 Goal 167.47 20.00% 7/1/15 Goal 53.21 20.00% 7/1/15 Goal 28.58 23.06% Current 201.26 24.04% Current 60.83 22.86% Current

Number of employees receiving increases includes only those employed on 6/30/2014. Number of classified employees paid at step includes newly hired employees. We've tried to exclude reclassifications, but some may be included in the increases. We've exclude those who changed positions. Achieved full funding of classified staff state chart in 2007; created institutional chart 10‐1‐2008 increasing all cells and adding a 16th column. All new entry rate hiring is done on the SU 2008 chart entry rate. In 2013 and 2014, SU has had insufficient funds to fund full step increases, even to the statutory chart. Staff have received an across the board percentage, so most classified staff who are between step 1 and 16 years of service credit are currently below their step on the statutory salary chart

13

slide-16
SLIDE 16

Annual Personnel Report 2014

West Virginia Higher Education Policy Commission ‐ FY 2015 Report of Institutional Salary Increases and Non‐Classified Percentages Number of Benefit Eligible Employees (FTE => .53) per Category ‐ Headcount Number of Benefit Eligible Employees (FTE => .53) per Category ‐ FTE Number of Part‐Time Regular (Excluding Adjunct Faculty) Employees (FTE < .53) per Category ‐ Headcount Number of Part‐Time Regular (Excluding Adjunct Faculty) Employees (FTE < .53) per Category ‐ FTE Number of Benefit Eligible Athletic Coaches included each Employee Category‐ Headcount Number of Benefit Eligible Athletic Coaches included each Employee Category ‐ FTE Total Base Salary Amount at end of FY 2013‐2014 (i.e. as of 6/30/14) Total Dollars Utilized for Salary Increases (excluding benefit costs) on or after July 1, 2014 ‐ Include all faculty increases EXCEPT increases for promotion in rank. Report faculty promotion in rank increases on the next line. Total Dollars Utilized for Faculty Promotions in Rank (excluding benefit costs) Total Dollar Amount of Salary Increases Provided by Category Total Base Salary Amount After FY 2014‐2015 Salary Increases. FY 2014 Total Base Salary plus Total Dollars Utilized for Salary Increase plus Total Dollars Utilized for Faculty Promotions in Rank. Number of Faculty Receiving Promotion in Rank Increases ‐ FTE Total Number of Employees Receiving Salary Increases including faculty promotions in rank ‐ Headcount Total Number of Employees Receiving Salary Increases including faculty promotions in rank ‐ FTE Average Amount of Increases per Employee FTE excluding Faculty Promotion in Rank Salary Increases as Percentage of Base Salary Average Amount of Increase for Faculty Promotion in Rank Average Employee Salary per Category after 2015 Salary Increase Faculty Classified Non‐Classified Institutional Totals Faculty Classified Non‐Classified Institutional Totals Faculty Classified Non‐Classified Institutional Totals 147 123 52 322 62 157 52 271 118 217 53 388 147.00 123.00 52.00 322 58.53 154.45 52.00 264.98 117.90 216.53 52.53 386.96 0.00 0.00 0.00 3.00 2.00 0.00 5 0.00 1.00 1.00 2 0.00 0.00 0.00 1.03 0.90 0.00 1.93 0.00 0.53 0.45 0.98 17 17 10 10 0.00 0.00 17.00 17 0.00 0.00 0.00 9.53 9.53 $9,027,328 $3,993,179 $3,098,926 $16,119,433 $7,377,840 $5,926,560 $4,617,528 $17,921,928 $6,473,787 $5,218,686 $3,783,393 $15,475,865 $180,000 $103,027 $5,000 $288,027 $54,120 $82,176 $26,208 $162,504 $0 $14,387 $294,379 $308,765 $31,715 $31,715 $35,976 $35,976 $42,260 $42,260 $211,715 $103,027 $5,000 $319,742 $90,096 $82,176 $26,208 $198,480 $42,260 $14,387 $294,379 $351,025 $9,239,043 $4,096,206 $3,103,926 $16,439,175 $7,467,936 $6,008,736 $4,643,736 $18,120,408 $6,516,047 $5,233,072 $4,077,771 $15,826,891 12 12 3 3 10 10 147 123 1 271 61 151 52 264 118 213 53 384 147.00 123.00 1.00 271.00 58.56 149.35 52.00 259.91 117.90 212.53 52.53 382.96 $1,333 $838 $5,000 $1,112 $974 $550 $504 $633 $0 $68 $5,604 $828 2.35% 2.58% 0.16% 1.98% 1.22% 1.39% 0.57% 1.11% 0.65% 0.28% 7.78% 2.27% $2,643 $2,643 $11,992 $11,992 $4,226 $4,226 $62,851 $33,302 $59,691 $51,053 $125,385 $38,679 $89,303 $67,890 $55,268 $24,109 $76,968 $40,797

West Virginia School of Osteopathic Medicine West Liberty University West Virginia State University

WV Code §18B‐9‐3 Temporary Classified Employee Salary Schedule ‐ Percent of Full Funding (as of October 2014 ‐with current service years) Amount needed to be fully funded as of October 1, 2014 WV Code §18B‐9‐3 Temporary Classified Employee Salary Schedule Percent of Full Funding (using service as of October 2010) Number of Classified Employees Paid Below Step ‐ Headcount Number of Classified Employees Paid Above Step ‐ Headcount Number of Classified Employees Paid Above Step Receiving Increases ‐ Headcount Effective Date (or Proposed Effective Date) of Increases Date of Board of Governors' Approval Is your institution administering compensation using the Temporary Classified Employee Salary Schedule published in WV Code §18B‐9‐3? If not, what year did you begin using a modified version of the classified employee salary structure? Provide Notes or Explanations here: §18B‐7‐11 Employees Designated as Non‐classified 20% NC Goal Calculation: (FTE of Retirement program eligible classified employees less FTE retirement program eligible classified athletic coaches) plus (FTE of retirement program eligible Non‐classified employees less FTE retirement program eligible Non‐classified athletic coaches) times .20 = July 1, 2015 Goal for FTE number of non‐classified employees Current retirement program eligible FTE number of non‐classified employees less FTE retirement program eligible non‐classified athletic coaches 100.00% 100.00% 100.00% $0 $0 $0 100.00% 100.00% 0.67% 0.00 0.00 0.67 46.00 151.00 0.00 46.00 151.00 0.00 Unknown Unknown Unknown 07/01/14 07/01/14 07/01/14 01/01/14 07/01/14 07/01/14 Unknown Unknown Unknown 03/08/14 03/08/14 03/08/14 12/05/13 05/01/14 05/01/14 No No yes N/A 1‐Jul‐11 Non‐classified FTE Percentage Non‐classified FTE Percentage Non‐classified FTE Percentage 31.60 20.00% 7/1/15 Goal 41.29 20.00% 7/1/15 Goal 51.91 20.00% 7/1/15 Goal 35.00 22.15% Current 52.00 25.19% Current 43.00 16.57% Current

WVSOM implemented a new classified salary structure on July 1, 2011. The WVSOM Classified Salary Schedule is $3,000 above the Salary Schedule published in WV Code §18B‐9‐3.

14

slide-17
SLIDE 17

Annual Personnel Report 2014

West Virginia Higher Education Policy Commission ‐ FY 2015 Report of Institutional Salary Increases and Non‐Classified Percentages Number of Benefit Eligible Employees (FTE => .53) per Category ‐ Headcount Number of Benefit Eligible Employees (FTE => .53) per Category ‐ FTE Number of Part‐Time Regular (Excluding Adjunct Faculty) Employees (FTE < .53) per Category ‐ Headcount Number of Part‐Time Regular (Excluding Adjunct Faculty) Employees (FTE < .53) per Category ‐ FTE Number of Benefit Eligible Athletic Coaches included each Employee Category‐ Headcount Number of Benefit Eligible Athletic Coaches included each Employee Category ‐ FTE Total Base Salary Amount at end of FY 2013‐2014 (i.e. as of 6/30/14) Total Dollars Utilized for Salary Increases (excluding benefit costs) on or after July 1, 2014 ‐ Include all faculty increases EXCEPT increases for promotion in rank. Report faculty promotion in rank increases on the next line. Total Dollars Utilized for Faculty Promotions in Rank (excluding benefit costs) Total Dollar Amount of Salary Increases Provided by Category Total Base Salary Amount After FY 2014‐2015 Salary Increases. FY 2014 Total Base Salary plus Total Dollars Utilized for Salary Increase plus Total Dollars Utilized for Faculty Promotions in Rank. Number of Faculty Receiving Promotion in Rank Increases ‐ FTE Total Number of Employees Receiving Salary Increases including faculty promotions in rank ‐ Headcount Total Number of Employees Receiving Salary Increases including faculty promotions in rank ‐ FTE Average Amount of Increases per Employee FTE excluding Faculty Promotion in Rank Salary Increases as Percentage of Base Salary Average Amount of Increase for Faculty Promotion in Rank Average Employee Salary per Category after 2015 Salary Increase Faculty Classified Non‐Classified Institutional Totals Faculty Classified Non‐Classified Institutional Totals Faculty Classified Non‐Classified Institutional Totals 3,198 2,790 936 6,924 28 43 71 28 25 53 3159.79 2751.87 928.95 6840.61 0.00 28.00 42.80 70.8 0.00 28.00 25.00 53 94.00 29.00 14.00 137 0.00 0.00 1.00 1 0.00 0.00 0.00 26.23 13.86 4.62 44.71 0.00 0.00 0.30 0.3 0.00 0.00 0.00 72 3 75 72.00 3.00 75 0.00 0.00 0.00 0.00 0.00 0.00 $217,185,681 $89,355,951 $75,664,242 $382,205,875 $0 $891,601 $3,576,802 $4,468,403 $0 $1,473,876 $1,634,938 $3,108,815 $1,602,014 $1,395,198 $470,978 $3,468,189 $0 $10,584 $57,722 $68,306 $0 $18,859 $65,088 $83,947 $725,435 $725,435 $0 $0 $0 $0 $2,327,449 $1,395,198 $470,978 $4,193,624 $0 $10,584 $57,722 $68,306 $0 $18,859 $65,088 $83,947 $219,513,130 $90,751,149 $76,135,220 $386,399,499 $0 $902,185 $3,634,524 $4,536,709 $0 $1,492,735 $1,700,026 $3,192,762 108 108 3,198 2,790 936 6924 28 43 71 28 25 53 3159.79 2751.87 928.95 6,840.61 28.00 42.80 70.80 0.00 28.00 25.00 53.00 $525 $507 $507 $515 $378 $1,349 $965 $674 $2,604 $1,584 1.07% 1.56% 0.62% 1.10% 1.19% 1.61% 1.53% 1.28% 3.98% 2.70% $6,717 $6,717 $0 $0 $68,899 $32,813 $81,553 $56,119 $32,221 $84,328 $63,807 $53,312 $68,001 $60,241

West Virginia Higher Education Policy Commission West Virginia Network for Educational Telecomputing West Virginia University

WV Code §18B‐9‐3 Temporary Classified Employee Salary Schedule ‐ Percent of Full Funding (as of October 2014 ‐with current service years) Amount needed to be fully funded as of October 1, 2014 WV Code §18B‐9‐3 Temporary Classified Employee Salary Schedule Percent of Full Funding (using service as of October 2010) Number of Classified Employees Paid Below Step ‐ Headcount Number of Classified Employees Paid Above Step ‐ Headcount Number of Classified Employees Paid Above Step Receiving Increases ‐ Headcount Effective Date (or Proposed Effective Date) of Increases Date of Board of Governors' Approval Is your institution administering compensation using the Temporary Classified Employee Salary Schedule published in WV Code §18B‐9‐3? If not, what year did you begin using a modified version of the classified employee salary structure? Provide Notes or Explanations here: §18B‐7‐11 Employees Designated as Non‐classified 20% NC Goal Calculation: (FTE of Retirement program eligible classified employees less FTE retirement program eligible classified athletic coaches) plus (FTE of retirement program eligible Non‐classified employees less FTE retirement program eligible Non‐classified athletic coaches) times .20 = July 1, 2015 Goal for FTE number of non‐classified employees Current retirement program eligible FTE number of non‐classified employees less FTE retirement program eligible non‐classified athletic coaches 106.00% 100.00% $0 $0 100.00% 100.00% 100.00% N/A 0.00 0.00 N/A 28.00 24.00 N/A 28.00 24.00 07/01/14 na 07/01/14 07/01/14 08/01/14 10/01/14 06/05/14 na na na n/a n/a No yes yes n/a Non‐classified FTE Percentage 735.56 20.00% 7/1/15 Goal 925.95 25.18% Current WVU implemented anew classified staff salary structure on October 1, 2012

15

slide-18
SLIDE 18

Annual Personnel Report 2014

West Virginia Council for Community and Technical College Education ‐ FY 2015 Report of Institutional Salary Increases and Non‐Classified Percentages Faculty Classified Non‐Classified Institutional Totals Faculty Classified Non‐Classified Institutional Totals Faculty Classified Non‐Classified Institutional Totals Number of Benefit Eligible Employees (FTE => .53) per Category ‐ Headcount 73 42 10 125 89 54 19 162 14 21 6 41 Number of Benefit Eligible Employees (FTE => .53) per Category ‐ FTE 73.00 41.75 10.00 124.75 88.06 53.67 18.06 159.79 14.00 20.60 6.00 40.6 Number of Part Time Regular (Excluding Adjunct Faculty) Employees (FTE < .53) per Category ‐ Headcount 0.00 14.00 19.00 33 0.00 0.00 0.00 1.00 9.00 0.00 10 Number of Part Time Regular (Excluding Adjunct Faculty) Employees (FTE < .53) per Category ‐ FTE 0.00 7.00 1.40 8.4 0.00 0.00 0.00 0.50 4.17 0.00 4.67 Number of Benefit Eligible Athletic Coaches included each Employee Category‐ Headcount Number of Benefit Eligible Athletic Coaches included Each Employee Category ‐ FTE 0.00 0.00 0.00 0.00 0.00 0.00 Total Base Salary Amount at end of FY 2013‐2014 (i.e. as of 6/30/14) $4,128,537 $1,325,914 $773,133 $6,227,584 $4,334,705 $1,886,388 $1,453,049 $7,674,142 $615,848 $786,459 $482,000 $1,884,307 Total Dollars Utilized for Salary Increases (excluding benefit costs) on or after July 1 2014 ‐ Include all faculty increases EXCEPT increases for promotion in rank. Report faculty promotion in rank increases on the next line. $80,075 $34,302 $21,951 $136,328 $114,968 $50,165 $9,102 $174,235 $14,556 $20,111 $10,031 $44,698 Total Dollars Utilized for Faculty Promotions in Rank (excluding benefit costs) $49,649 $49,649 $72,614 $72,614 $3,379 $3,379 Total Dollar Amount of Salary Increases Provided by category $129,724 $34,302 $21,951 $185,977 $187,582 $50,165 $9,102 $246,849 $17,935 $20,111 $10,031 $48,077 Total Base Salary Amount After FY 2014‐2015 Salary Increases. FY 2014 total base salary plus Total Dollars Utilized for Salary Increase plus Total dollars utilized for faculty promotions in rank. $4,258,261 $1,360,216 $795,084 $6,413,561 $4,522,288 $1,936,553 $1,462,151 $7,920,992 $633,783 $806,570 $492,031 $1,932,384 Number of faculty receiving promotion in rank increases ‐ FTE 6 6 16 16 1 1 Total Number of Employees Receiving Salary Increases including faculty promotions in rank ‐ Headcount 73 56 11 140 82 45 19 146 13 28 5 46 Total Number of Employees Receiving Salary Increases including faculty promotions in rank ‐ FTE 73.00 48.75 10.50 132.25 81.06 44.67 18.06 143.79 13.00 23.75 5.00 41.75 Average Amount of Increases per Employee FTE excluding Faculty Promotion in Rank $1,195 $704 $2,091 $1,080 $1,767 $1,123 $504 $1,363 $1,213 $847 $2,006 $1,097 Salary Increases as percentage of base salary 3.14% 2.59% 2.84% 2.99% 4.33% 2.66% 0.63% 3.22% 2.91% 2.56% 2.08% 2.55% Average amount of Increase for Faculty Promotion in Rank $8,275 $8,275 $4,538 $4,538 $3,379 $3,379 Average Employee Salary per Category after 2015 Salary Increase $58,332 $27,902 $69,744 $48,168 $51,355 $36,083 $80,961 $49,571 $43,709 $32,562 $82,005 $42,686 WV Code 18B‐9‐3 Temporary Classified Employee Salary Schedule ‐ Percent of Full Funding (as of October 2014 ‐with current service years) 100.00% 100.00% 100.00% Amount need to be fully funded as of October 1, 2014 $0 $0 $0 WV Code 18B‐9‐3 Temporary Classified Employee Salary Schedule Percent of Full Funding (using service as of October 2010) 100.00% 100.00% 100.00% Number of Classified Employee Paid Below Step ‐ Headcount 0.00 0.00 0.00 Number of Classified Employees Paid Above Step ‐ Headcount 42.00 43.00 1.00 Number of Classified Employees Paid Above Step Receiving Increases ‐ Headcount 41.75 15.00 1.00 Effective Date (or Proposed Effective Date) of Increases 07/01/14 07/01/14 07/01/14 Fall 2014 07/01/14 07/01/14 07/01/14 07/01/14 07/01/14 Date of Board of Governors' Approval 05/07/14 05/07/14 05/07/14 03/28/14 03/28/14 03/28/14 02/19/14 02/19/14 02/19/14 Is your institution administering compensation using the Temporary Classified Employee Salary Schedule published in WV Code §18B‐9‐3? No Yes yes If not, what year did you begin using a modified version of the classified employee salary structure? 1‐Jul‐12 n/a §18B‐7‐11 Employees Designated as Non‐Classified Non‐Classified FTE Percentage Non‐Classified FTE Percentage Non‐Classified FTE Percentage 20% NC Goal Calculation: (FTE of Retirement program eligible classified employees less FTE retirement program eligible classified athletic coaches) plus (FTE of retirement program eligible Non‐Classified employees less FTE retirement program eligible Non‐Classified athletic coaches) times .20 = July 1, 2015 Goal for FTE number of Non‐Classified employees 10.35 20.00% 7/1/15 Goal 14.35 20.00% 7/1/15 Goal 5.32 20.00% 7/1/15 Goal Current Retirement program eligible FTE number of Non‐Classified Employees less FTE retirement program eligible Non‐Classified athletic coaches 10.00 19.32% Current 18.06 25.18% Current 6.00 22.56% Current Provide Notes or Explanations here:

Blue Ridge Community and Technical College

P/T Non‐classified, non‐exempt employees are Hollywood Casino"training specialists" (dealer trainers at 0.05 FTE based on prior year) sans one 0.5 FTE, Director of Customized Training. Those receiving faculty promotion in rank also eligible for annual increase based on BOG approval. Faculty and non‐classified total salary increase as percentage of base impacted by promotions and position changes.

The across the board $504/1.0 FTE was awarded to the benefits‐eligible employees on payroll as of 1/1/2014. We have hired numerous employees since that would not have had the increase. We have had 7 CL PIQ reviews since 7/1/14, resulting in a total of $20,894 in increases through a change in paygrade. Those numbers are not included in the numbers above. The number in D38 is lower as of Oct 2014 than D26 as we had 2 people leave.

BridgeValley Community and Technical College

BRCTC classified employee salary schedule is $2,000 above 2001 Temporary Classified Employee Salary Schedule for each grade/step. Therefore, all f/t, benefits‐eligible classified employees are above temporary classified salary schedule step value for the respective years of service. P/T, non‐benefits eligible classified EEs are not included in calculation.

Eastern West Virginia Community and Technical College

16

slide-19
SLIDE 19

Annual Personnel Report 2014

West Virginia Council for Community and Technical College Education ‐ FY 2015 Report of Institutional Salary Increases and Non‐Classified Percentages Number of Benefit Eligible Employees (FTE => .53) per Category ‐ Headcount Number of Benefit Eligible Employees (FTE => .53) per Category ‐ FTE Number of Part Time Regular (Excluding Adjunct Faculty) Employees (FTE < .53) per Category ‐ Headcount Number of Part Time Regular (Excluding Adjunct Faculty) Employees (FTE < .53) per Category ‐ FTE Number of Benefit Eligible Athletic Coaches included each Employee Category‐ Headcount Number of Benefit Eligible Athletic Coaches included Each Employee Category ‐ FTE Total Base Salary Amount at end of FY 2013‐2014 (i.e. as of 6/30/14) Total Dollars Utilized for Salary Increases (excluding benefit costs) on or after July 1 2014 ‐ Include all faculty increases EXCEPT increases for promotion in rank. Report faculty promotion in rank increases on the next line. Total Dollars Utilized for Faculty Promotions in Rank (excluding benefit costs) Total Dollar Amount of Salary Increases Provided by category Total Base Salary Amount After FY 2014‐2015 Salary Increases. FY 2014 total base salary plus Total Dollars Utilized for Salary Increase plus Total dollars utilized for faculty promotions in rank. Number of faculty receiving promotion in rank increases ‐ FTE Total Number of Employees Receiving Salary Increases including faculty promotions in rank ‐ Headcount Total Number of Employees Receiving Salary Increases including faculty promotions in rank ‐ FTE Average Amount of Increases per Employee FTE excluding Faculty Promotion in Rank Salary Increases as percentage of base salary Average amount of Increase for Faculty Promotion in Rank Average Employee Salary per Category after 2015 Salary Increase WV Code 18B‐9‐3 Temporary Classified Employee Salary Schedule ‐ Percent of Full Funding (as of October 2014 ‐with current service years) Amount need to be fully funded as of October 1, 2014 WV Code 18B‐9‐3 Temporary Classified Employee Salary Schedule Percent of Full Funding (using service as of October 2010) Number of Classified Employee Paid Below Step ‐ Headcount Number of Classified Employees Paid Above Step ‐ Headcount Number of Classified Employees Paid Above Step Receiving Increases ‐ Headcount Effective Date (or Proposed Effective Date) of Increases Date of Board of Governors' Approval Is your institution administering compensation using the Temporary Classified Employee Salary Schedule published in WV Code §18B‐9‐3? If not, what year did you begin using a modified version of the classified employee salary structure? §18B‐7‐11 Employees Designated as Non‐Classified 20% NC Goal Calculation: (FTE of Retirement program eligible classified employees less FTE retirement program eligible classified athletic coaches) plus (FTE of retirement program eligible Non‐Classified employees less FTE retirement program eligible Non‐Classified athletic coaches) times .20 = July 1, 2015 Goal for FTE number of Non‐Classified employees Current Retirement program eligible FTE number of Non‐Classified Employees less FTE retirement program eligible Non‐Classified athletic coaches Provide Notes or Explanations here: Faculty Classified Non‐Classified Institutional Totals Faculty Classified Non‐Classified Institutional Totals Faculty Classified Non‐Classified Institutional Totals 65 45 13 123 71 78 15 164 56 28 12 96 65.00 45.00 13.00 123 71.00 78.00 15.00 164 65.00 23.44 10.97 99.41 0.00 0.00 0.00 0.00 0.00 0.00 0.00 6.00 2.00 8 0.00 0.00 0.00 0.00 0.00 0.00 0.00 3.06 1.02 4.08 0.00 0.00 0.00 0.00 0.00 0.00 0.00 0.00 0.00 $2,933,637 $1,495,279 $969,324 $5,398,240 $3,704,299 $2,661,096 $1,182,208 $7,547,603 $3,230,254 $871,424 $962,458 $5,064,136 $32,760 $19,656 $5,544 $57,960 $62,216 $69,210 $20,666 $152,092 $38,198 $33,521 $15,636 $87,355 $45,640 $45,640 $16,692 $16,692 $17,625 $17,625 $78,400 $19,656 $5,544 $103,600 $78,908 $69,210 $20,666 $168,784 $55,823 $33,521 $15,636 $104,980 $3,012,037 $1,514,935 $974,868 $5,501,840 $3,783,207 $2,730,306 $1,202,874 $7,716,387 $3,286,077 $904,945 $978,094 $5,169,116 10 10 2 2 4 4 65 39 11 115 68 78 13 159 60 24 12 96 65.00 39.00 11.00 115.00 68.00 78.00 13.00 159.00 64.00 23.44 10.97 98.41 $596 $504 $504 $552 $943 $887 $1,590 $969 $637 $1,430 $1,425 $925 2.67% 1.31% 0.57% 1.92% 2.13% 2.60% 1.75% 2.24% 1.73% 3.85% 1.62% 2.07% $4,564 $4,564 $8,346 $8,346 $4,406 $4,406 $46,339 $33,665 $74,990 $44,730 $53,285 $35,004 $80,192 $47,051 $50,555 $34,149 $81,576 $49,948 95.74% 100.00% 100.00% $80,528 $0 N/A 100.00% 100.00% 100.00% 28.00 0.00 0.00 9.00 16.00 4.00 9.00 16.00 4.00 07/01/14 07/01/14 07/01/14 07/01/14 07/01/14 07/01/14 07/01/14 07/01/14 07/01/14 04/17/14 04/17/14 04/17/14 05/01/14 05/01/14 05/01/14 05/20/14 05/20/14 05/20/14 Yes Yes Yes n/a N/A Non‐Classified FTE Percentage Non‐Classified FTE Percentage Non‐Classified FTE Percentage 11.60 20.00% 7/1/15 Goal 18.60 20.00% 7/1/15 Goal 6.88 20.00% 7/1/15 Goal 13.00 22.41% Current 15.00 16.13% Current 10.97 31.88% Current For classified employees, New River CTC utilized the salary schedule as a minimum salary. Classified employees were increased by the appropriate step or 2% above base salary whichever was greater. Classified employees above step 15 received a 2% increase in base salary. Faculty and non‐ classified employees received a 2% increase in base salary. Anyone hired

  • n or after January 1, 2014 did not receive a pay increase.

Mountwest Community and Technical College New River Community and Technical College Pierpont Community and Technical College

17

slide-20
SLIDE 20

Annual Personnel Report 2014

West Virginia Council for Community and Technical College Education ‐ FY 2015 Report of Institutional Salary Increases and Non‐Classified Percentages Number of Benefit Eligible Employees (FTE => .53) per Category ‐ Headcount Number of Benefit Eligible Employees (FTE => .53) per Category ‐ FTE Number of Part Time Regular (Excluding Adjunct Faculty) Employees (FTE < .53) per Category ‐ Headcount Number of Part Time Regular (Excluding Adjunct Faculty) Employees (FTE < .53) per Category ‐ FTE Number of Benefit Eligible Athletic Coaches included each Employee Category‐ Headcount Number of Benefit Eligible Athletic Coaches included Each Employee Category ‐ FTE Total Base Salary Amount at end of FY 2013‐2014 (i.e. as of 6/30/14) Total Dollars Utilized for Salary Increases (excluding benefit costs) on or after July 1 2014 ‐ Include all faculty increases EXCEPT increases for promotion in rank. Report faculty promotion in rank increases on the next line. Total Dollars Utilized for Faculty Promotions in Rank (excluding benefit costs) Total Dollar Amount of Salary Increases Provided by category Total Base Salary Amount After FY 2014‐2015 Salary Increases. FY 2014 total base salary plus Total Dollars Utilized for Salary Increase plus Total dollars utilized for faculty promotions in rank. Number of faculty receiving promotion in rank increases ‐ FTE Total Number of Employees Receiving Salary Increases including faculty promotions in rank ‐ Headcount Total Number of Employees Receiving Salary Increases including faculty promotions in rank ‐ FTE Average Amount of Increases per Employee FTE excluding Faculty Promotion in Rank Salary Increases as percentage of base salary Average amount of Increase for Faculty Promotion in Rank Average Employee Salary per Category after 2015 Salary Increase WV Code 18B‐9‐3 Temporary Classified Employee Salary Schedule ‐ Percent of Full Funding (as of October 2014 ‐with current service years) Amount need to be fully funded as of October 1, 2014 WV Code 18B‐9‐3 Temporary Classified Employee Salary Schedule Percent of Full Funding (using service as of October 2010) Number of Classified Employee Paid Below Step ‐ Headcount Number of Classified Employees Paid Above Step ‐ Headcount Number of Classified Employees Paid Above Step Receiving Increases ‐ Headcount Effective Date (or Proposed Effective Date) of Increases Date of Board of Governors' Approval Is your institution administering compensation using the Temporary Classified Employee Salary Schedule published in WV Code §18B‐9‐3? If not, what year did you begin using a modified version of the classified employee salary structure? §18B‐7‐11 Employees Designated as Non‐Classified 20% NC Goal Calculation: (FTE of Retirement program eligible classified employees less FTE retirement program eligible classified athletic coaches) plus (FTE of retirement program eligible Non‐Classified employees less FTE retirement program eligible Non‐Classified athletic coaches) times .20 = July 1, 2015 Goal for FTE number of Non‐Classified employees Current Retirement program eligible FTE number of Non‐Classified Employees less FTE retirement program eligible Non‐Classified athletic coaches Provide Notes or Explanations here: Faculty Classified Non‐Classified Institutional Totals Faculty Classified Non‐Classified Institutional Totals Faculty Classified Non‐Classified Institutional Totals 68 83 23 174 64 75 18 157 95 87 28 210 68.00 81.50 23.00 172.5 64.00 75.00 18.00 157 95.00 85.88 28.00 208.88 0.00 5.00 0.00 5 0.00 4.00 0.00 4 0.00 6.00 0.00 6 0.00 2.29 0.00 2.29 0.00 2.00 0.00 2 0.00 2.74 0.00 2.74 0.00 0.00 0.00 0.00 0.00 0.00 0.00 0.00 0.00 $2,849,544 $2,709,863 $1,590,073 $7,149,480 $2,791,179 $2,520,554 $1,347,653 $6,659,386 $4,613,079 $2,830,577 $1,573,082 $9,016,738 $34,272 $42,230 $11,592 $88,094 $38,983 $48,912 $17,016 $104,911 $140,050 $63,044 $14,112 $217,206 $23,331 $23,331 $0 $0 $36,124 $36,124 $57,603 $42,230 $11,592 $111,425 $38,983 $48,912 $17,016 $104,911 $176,174 $63,044 $14,112 $253,330 $2,907,147 $2,752,093 $1,601,665 $7,260,905 $2,830,162 $2,569,466 $1,364,669 $6,764,297 $4,789,253 $2,893,621 $1,587,194 $9,270,068 6 6 8 8 68 83 23 174 60 66 15 141 95 93 28 216 68.00 81.50 23.00 172.50 60.00 66.00 15.00 141.00 95.00 88.62 28.00 211.62 $553 $518 $504 $529 $650 $741 $1,134 $744 $1,610 $711 $504 $1,067 2.02% 1.56% 0.73% 1.56% 1.40% 1.94% 1.26% 1.58% 3.82% 2.23% 0.90% 2.81% $3,889 $3,889 $0 $0 $4,516 $4,516 $42,752 $32,845 $69,638 $41,541 $44,221 $33,370 $75,815 $42,543 $50,413 $32,652 $56,686 $43,805 95.80% 100.00% 100.00% $170,396 $0 $0 100.00% 100.00% 100.00% 68.00 0.00 0.00 10.00 14.00 35.00 10.00 14.00 35.00 08/01/14 07/01/14 07/01/14 08/18/14 07/01/14 07/01/14 07/01/14 07/01/14 07/01/14 04/22/14 04/22/14 04/22/14 04/21/14 04/21/14 04/21/14 05/21/14 05/21/14 05/21/14 YES Yes Yes NA Non‐Classified FTE Percentage Non‐Classified FTE Percentage Non‐Classified FTE Percentage 20.90 20.00% 7/1/15 Goal 18.60 20.00% 7/1/15 Goal 22.78 20.00% 7/1/15 Goal 23.00 22.01% Current 18.00 19.35% Current 28.00 24.59% Current

Did not include temporary hourly employees or student workers Included vacant positions in headcount and FTE Those reported "Paid above step" are the employees with 15+ years of service

West Virginia Northern Community College Southern West Virginia Community and Technical College West Virginia University ‐ Parkersburg

18

slide-21
SLIDE 21

Annual Personnel Report 2014

West Virginia Council for Community and Technical College Education ‐ FY 2015 Report of Institutional Salary Increases and Non‐Classified Percentages Number of Benefit Eligible Employees (FTE => .53) per Category ‐ Headcount Number of Benefit Eligible Employees (FTE => .53) per Category ‐ FTE Number of Part Time Regular (Excluding Adjunct Faculty) Employees (FTE < .53) per Category ‐ Headcount Number of Part Time Regular (Excluding Adjunct Faculty) Employees (FTE < .53) per Category ‐ FTE Number of Benefit Eligible Athletic Coaches included each Employee Category‐ Headcount Number of Benefit Eligible Athletic Coaches included Each Employee Category ‐ FTE Total Base Salary Amount at end of FY 2013‐2014 (i.e. as of 6/30/14) Total Dollars Utilized for Salary Increases (excluding benefit costs) on or after July 1 2014 ‐ Include all faculty increases EXCEPT increases for promotion in rank. Report faculty promotion in rank increases on the next line. Total Dollars Utilized for Faculty Promotions in Rank (excluding benefit costs) Total Dollar Amount of Salary Increases Provided by category Total Base Salary Amount After FY 2014‐2015 Salary Increases. FY 2014 total base salary plus Total Dollars Utilized for Salary Increase plus Total dollars utilized for faculty promotions in rank. Number of faculty receiving promotion in rank increases ‐ FTE Total Number of Employees Receiving Salary Increases including faculty promotions in rank ‐ Headcount Total Number of Employees Receiving Salary Increases including faculty promotions in rank ‐ FTE Average Amount of Increases per Employee FTE excluding Faculty Promotion in Rank Salary Increases as percentage of base salary Average amount of Increase for Faculty Promotion in Rank Average Employee Salary per Category after 2015 Salary Increase WV Code 18B‐9‐3 Temporary Classified Employee Salary Schedule ‐ Percent of Full Funding (as of October 2014 ‐with current service years) Amount need to be fully funded as of October 1, 2014 WV Code 18B‐9‐3 Temporary Classified Employee Salary Schedule Percent of Full Funding (using service as of October 2010) Number of Classified Employee Paid Below Step ‐ Headcount Number of Classified Employees Paid Above Step ‐ Headcount Number of Classified Employees Paid Above Step Receiving Increases ‐ Headcount Effective Date (or Proposed Effective Date) of Increases Date of Board of Governors' Approval Is your institution administering compensation using the Temporary Classified Employee Salary Schedule published in WV Code §18B‐9‐3? If not, what year did you begin using a modified version of the classified employee salary structure? §18B‐7‐11 Employees Designated as Non‐Classified 20% NC Goal Calculation: (FTE of Retirement program eligible classified employees less FTE retirement program eligible classified athletic coaches) plus (FTE of retirement program eligible Non‐Classified employees less FTE retirement program eligible Non‐Classified athletic coaches) times .20 = July 1, 2015 Goal for FTE number of Non‐Classified employees Current Retirement program eligible FTE number of Non‐Classified Employees less FTE retirement program eligible Non‐Classified athletic coaches Provide Notes or Explanations here: Faculty Classified Non‐Classified Institutional Totals 3 11 14 0.00 3.00 11.00 14 0.00 0.00 0.00 0.00 0.00 0.00 0.00 0.00 0.00 $0 $180,914 $742,700 $923,614 $1,520 $4,536 $6,056 $0 $0 $1,520 $4,536 $6,056 $0 $182,434 $747,236 $929,670 3 9 12 0.00 3.00 9.00 12.00 $507 $504 $505 0.84% 0.61% 0.66% $0 $60,811 $67,931 $66,405 110.00% $0 100.00% 0.00 3.00 3.00 07/01/14 na yes

West Virginia Council for Community and Technical College Education

19

slide-22
SLIDE 22

20

slide-23
SLIDE 23

Report to the Legislative Oversight Commission

  • n Education Accountability

January 11, 2015 2014 System Performance Report

21

slide-24
SLIDE 24

22

slide-25
SLIDE 25

MEMORANDUM TO: Legislative Oversight Commission on Education Accountability FROM: Paul L. Hill DATE: January 11, 2015 RE: 2014 System Performance Report As required by West Virginia Code §18B-1B-4, the West Virginia Higher Education Policy Commission (Commission) hereby provides its annual report on system-wide performance of state institutions. As a broad indicator of performance, this report tracks the development, implementation and assessment of the Commission’s public policy agenda. The system Higher Education Report Card, also developed and provided during this timeframe, encompasses greater numbers of metrics, performance indicators, and data analyses and therefore should be considered in unison with this report. Formulated under the authority of West Virginia Code §18B-1D-5, the 2013-2018 Master Plan: “Leading the Way: Access, Success and Impact,” is currently in its first year of implementation. Campus officials submitted institutional Compacts in November 2014 describing their plans for the next five years in accomplishing West Virginia postsecondary goals, which are now under

  • review. This Performance Report is limited to key metrics continued from last year’s report, that

were available for the completion of the 2014 West Virginia Report Card. The latest measures and highlights in the areas of 1) Undergraduate Enrollment, 2) Graduate Enrollment, 3) Undergraduate Tuition and Fees In-State, 4) Undergraduate Tuition and Fees Non-Resident, 5) Retention Rates, 6) Graduation Rates, 7) STEM Degrees Awarded, and 8) Degrees Awarded by Level, are provided. The data shown include the academic year 2013-2014. West Virginia higher education institutions followed the recent national trend experiencing enrollment growth during the economic recession beginning in 2008 peaking in 2011 and slowly declining as the economy recovered. Tuition and fees steadily increased over the same period, also following the same trend nationally albeit less dramatically than in many other states. Retention rates fell slightly as did graduation rates although national data now available indicates another six percent of the state’s students completed a degree in another state. The System’s efforts to increase degree production are showing positive results with growth in numbers of STEM degrees and unprecedented total annual degrees awarded.

23

slide-26
SLIDE 26

Undergraduate Enrollment (Fall End-of-Term data; fall 2014 end-of-term data not available until late January)

Institution 2009 2010 2011 2012 2013 2012-2013 % Change 2009-2013 % Change

Bluefield State College 2,058 2,101 2,051 1,951 1,762

  • 9.7%
  • 14.4%

Concord University 2,677 2,672 2,683 2,622 2,510

  • 4.3%
  • 6.2%

Fairmont State University 4,223 4,362 4,269 4,114 3,956

  • 3.8%
  • 6.3%

Glenville State College 1,756 1,831 1,926 1,891 1,740

  • 8.0%
  • 0.9%

Marshall University 9,692 10,018 10,053 9,885 9,756

  • 1.3%

0.7% Potomac State College of WVU 1,807 1,831 1,800 1,779 1,660

  • 6.7%
  • 8.1%

Shepherd University 4,216 4,182 4,279 4,289 4,081

  • 4.8%
  • 3.2%

WVU Institute of Technology 1,255 1,213 1,313 1,097 1,211 10.4%

  • 3.5%

West Liberty University 2,598 2,688 2,729 2,712 2,647

  • 2.4%

1.9% West Virginia State University 3,923 3,156 2,794 2,600 2,609 0.3%

  • 33.5%

West Virginia University 21,740 22,301 22,711 22,822 22,764

  • 0.3%

4.7% Total 55,945 56,355 56,608 55,762 54,696

  • 1.9%
  • 2.2%

Highlights  Students enrolled in for-credit classes decreased 1.9 percent, from 55,762 in 2012-13 to 54,696 in 2013-14.  For-credit enrollment has decreased 2.2 percent since 2009 representing a decline in actual students of 1.249. Graduate Enrollment (Fall End-of-Term data; fall 2014 end-of-term data not available until late January)

Institution 2009 2010 2011 2012 2013 2012-2013 % Change 2009-2013 % Change

Concord University 247 247 412 217 285 31.3% 15.4% Fairmont State University 349 346 349 338 274

  • 18.9%
  • 21.5%

Marshall University 4,084 4,174 3,913 3,823 3,651

  • 4.5%
  • 10.6%

Shepherd University 154 154 155 157 175 11.5% 13.6% WV School of Osteopathic Medicine 778 806 816 827 825

  • 0.2%

6.0% West Liberty University 47 50 59 82 133 62.2% 183.0% West Virginia State University 48 83 55 83 55

  • 33.7%

14.6% West Virginia University 7,405 7,286 7,231 7,141 6,909

  • 3.2%
  • 6.7%

Total 13,112 13,146 12,990 12,668 12,307

  • 2.8%
  • 6.1%

24

slide-27
SLIDE 27

Highlights  Graduate students enrolled in for-credit classes decreased 2.8 percent, from 12,668 in 2012-13 to 12,307 in 2013-14.  For-credit enrollment has decreased 6.1 percent since 2009, representing a decrease in actual students of 805. Average Undergraduate Tuition & Fees for In-State and Out-of-State Students Highlights  Average undergraduate tuition for in-state students increased 5.4 percent, from $5,528 in 2012- 13 to $5,827 in 2013-14.  The five-year trend in tuition and fees shows an increase of 21.5 percent for in-state students and 18.8 percent for out-of-state students. One-Year Retention Rates (Percent Returning in Fall from Previous Fall’s Cohort based on End-of-Term Data; all 2014 end-of-term data not available until late January)

Institution 2009 2010 2011 2012 2013 Bluefield State College 65.0% 65.2% 59.9% 61.9% 65.9% Concord University 70.6% 73.3% 71.1% 71.7% 71.4% Fairmont State University 71.2% 73.6% 72.8% 72.6% 70.9% Glenville State College 60.6% 66.3% 65.5% 61.3% 62.8% Marshall University 77.2% 77.2% 76.1% 77.7% 75.3% Potomac State College Of WVU 61.7% 60.9% 58.9% 56.4% 56.8% Shepherd University 70.4% 75.6% 72.6% 67.6% 74.3% West Liberty University 74.3% 81.3% 75.6% 77.6% 75.7% West Virginia State University 66.7% 61.6% 67.2% 60.7% 62.5% West Virginia University 82.8% 82.3% 80.5% 78.7% 80.0% WVU Institute of Technology 61.8% 57.8% 68.3% 54.9% 68.9% Total 76.1% 76.3% 75.1% 73.7% 74.7%

Highlight  First-year full-time retention rates have declined 1.4 percentage points at four-year public institutions from 76.1 percent in 2009 to 74.7 percent in 2013.

2009 2010 2011 2012 2013 2012- 2013 2009- 2013 % Change % Change In-State $4,796 $4,832 $5,147 $5,528 $5,827 5.4% 21.5% Out-of- State $11,613 $12,077 $12,600 $12,831 $13,801 7.6% 18.8% 25

slide-28
SLIDE 28

Graduation Rate for Students Seeking a Bachelor’s Degree by Entering Fall Cohort ( Students graduating within six years from entry, so fall 2008 entrants graduating by spring 2014)

Institution 2004 2005 2006 2007 2008 Bluefield State College 14.4% 22.2% 22.2% 17.3% 25.0% Concord University 36.0% 37.2% 40.6% 39.2% 37.3% Fairmont State University 37.9% 36.2% 38.0% 37.6% 34.1% Glenville State College 32.7% 32.7% 32.9% 33.5% 31.2% Marshall University 47.6% 45.9% 45.1% 45.4% 45.2% Shepherd University 42.4% 46.7% 45.2% 39.8% 42.6% West Liberty University 38.9% 46.9% 40.1% 41.3% 39.5% West Virginia State University 21.2% 19.8% 17.7% 18.6% 19.6% West Virginia University 58.6% 56.7% 55.4% 56.0% 56.2% WVU Institute of Technology 35.1% 42.4% 34.5% 25.7% 27.0% Total 47.8% 47.8% 47.0% 46.3% 46.6%

Highlight  Six-year graduation rates declined at four-year public institutions from 47.8 percent for the 2004 cohort to 46.6 percent for the 2008 cohort, a decrease of 1.2 percentage points. Number of Degrees, by level, in Health, STEM, and STEM Education

Area of Concentration Level 2009 2010 2011 2012 2013 2012‐2013 % Change 2009‐2013 % Change Health Associate Degree 268 274 280 320 328 2.5% 22.4% Bachelor Degree 674 673 709 754 753 ‐0.1% 11.7% Doctoral Degree 10 13 16 17 9 ‐47.1% ‐10.0% Doctoral Professional Practice 501 547 519 569 552 ‐3.0% 10.2% Master Degree 288 263 296 335 388 15.8% 34.7% Total 1,741 1,770 1,820 1,995 2,030 1.8% 16.6% STEM Associate Degree 57 52 62 52 78 50.0% 36.8% Bachelor Degree 2,311 2,436 2,579 2,455 2,572 4.8% 11.3% Doctoral Degree 94 93 90 94 94 0.0% 0.0% Doctoral Professional Practice 4 8 10 11 8 ‐27.3% 100.0% Master Degree 318 401 397 377 356 ‐5.6% 11.9% Total 2,784 2,990 3,138 2,989 3,108 4.0% 11.6% STEM Education* Total 155 . . *Stem Education has not been historically collected. As a part of the Commission’s new Master Plan Leading the Way Access. Success. Impact., institutions began to provide this data in 2013. 26

slide-29
SLIDE 29

Highlights  The total number of health degrees has increased 1.8 percent from 1,995 in 2012 to 2,030 in 2013. The largest one year percentage increase was for Master’s degrees which increased 15.8 percent from 335 to 388. Health degrees have increased 16.6 percent from the 2009 figure of 1,741.  The total number of STEM degrees has increased 4 percent from 2,989 in 2012 to 3,108 in 2013. The largest one year percentage increase was for Associate’s degrees which increased 50 percent from 52 to 78.  Over the five year period, STEM degrees have increased 11.6 percent from the 2009 figure of 2,784. Degrees/Credentials Awarded by Level

Award Type 2009 2010 2011 2012 2013 2012-2013 % Change 2009-2013 % Change

Certificate 7 2 . . . . . Associate’s Degree 506 526 534 551 711 29.0% 40.5% Bachelor’s Degree 8,269 8,407 8,886 8,839 9,120 3.2% 10.3% Master's Degree 2,555 2,694 2,696 2,610 2,586

  • 0.9%

1.2% Post-Master's Certificate 26 21 16 21 20

  • 4.8%
  • 23.1%

Doctoral Professional Practice 676 715 698 732 714

  • 2.5%

5.6% Doctoral Research/Scholarship 157 178 178 174 165

  • 5.2%

5.1% Total 12,196 12,543 13,008 12,927 13,316 3.0% 9.2%

Highlights  The total number of degrees and credentials awarded at West Virginia colleges and universities in academic year 2013-14 was 13,316, which was 3.0 percent higher than the 2012-13 figure of 12,927.  Over the five-year time period, the number of degrees and credentials has increased by 9.2 percent from the 2009-10 level of 12,196.  The largest one-year increase in the number of awards was in bachelor’s degrees with a growth of 465 which occurred between 2010-11 and 2011-12.

27

slide-30
SLIDE 30

28

slide-31
SLIDE 31

Report to the Legislative Oversight Commission

  • n Education Accountability

January 11, 2015 Executive Summary 2014 West Virginia Higher Education Report Card

29

slide-32
SLIDE 32

30

slide-33
SLIDE 33

MEMORANDUM TO: Legislative Oversight Commission on Education Accountability FROM: Paul L. Hill James L. Skidmore DATE: January 11, 2015 RE: Executive Summary of 2014 Higher Education Report Card West Virginia Code §18B-1D-8 statutorily mandates the West Virginia Higher Education Report

  • Card. This annual accountability report provides year-end higher education statistics for both of

the state’s higher education systems, the West Virginia Higher Education Policy Commission (Commission) and West Virginia Council for Community and Technical College Education (Council). Many of the enrollment, retention, graduation, and financial aid statistics found throughout this publication are reflective of the individual master plans approved by the Commission (Leading the Way: Access. Success. Impact. 2013-2018) and Council (Meeting the Challenge 2010-2015). The systems’ master plans establish aspirational institutional and statewide goals for the state’s public higher education systems at a time when public postsecondary education is a critical component to the economic and civil success of the state. As the Council’s master plan comes to the end of its cycle in 2015, the public two-year system is in the process of developing a comprehensive master plan that renews its commitment to providing high-quality, accessible, and responsive education and training to the citizenry of West Virginia. The West Virginia Higher Education Report Card includes over 50 measures that serve to answer many of the most frequently asked questions about postsecondary statistics in West Virginia. Listed below are selected measures from the report that highlight both progress and challenge for public higher education in West Virginia. Narrative updates on specific Commission and Council initiatives can be found throughout the document.

West Virginia Higher Education Policy Commission West Virginia Community and Technical College System

1018 Kanawha Boulevard, East, Suite 700 Charleston, West Virginia 25301

Paul L. Hill, Ph.D.

Chancellor

Bruce L. Berry, M.D.

Chair

James L. Skidmore

Chancellor

Clarence “Butch” Pennington

Chair (304) 558-2101 www.hepc.wvnet.edu www.wvctcs.org

31

slide-34
SLIDE 34

State Highlights  The total number of degrees and credentials awarded at West Virginia public institutions during the 2013 academic year was 18,012, which is 6.3 percent higher than the figure of 16,938 in 2012. From 2004 to 2013, the total number of degrees and credentials has increased by 29 percent from the 2004 level of 13,963.  The largest increase in proportion of degrees over a 10-year period was in undergraduate certificates with an increase of 298.9 percent. The largest increase in number of awards was in baccalaureate degrees with a rise of 1,606.  The overall college-going rate decreased 0.5 percentage points from 56.4 percent to 55.9 percent between 2012 and 2013. The in-state college-going rate decreased from 48.4 to 48.2 percent between 2012 and 2013. Higher Education Policy Commission Highlights  Undergraduate students enrolled in for-credit classes decreased 1.9 percent, from 55,762 in 2012 to 54,696 in 2013. First-time freshmen enrolled in for-credit classes decreased 3.3 percent, from 11,567 in 2012-13 to 11,188 in 2013-14. First-time freshmen enrollment has decreased 1.6 percent since 2009, representing a decline in actual students

  • f 177.

 Graduate students enrolled in for-credit classes decreased 2.8 percent, from 12,668 in 2012-13 to 12,307 in 2013-14.  Students transferring from two-year to four-year public postsecondary institutions decreased 14.4 percent from 2012 to 2013. The number of two-year transfer students has decreased 15.2 percent when compared to 2009.  Average undergraduate tuition for in-state students increased 5.4 percent, from $5,528 in 2012-13 to $5,827 in 2013-14.  The 10-year trend in tuition and fees is an increase of 70 percent for in-state students and 59.9 percent for out-of-state students though the increase in dollars was larger for out-of- state students. In-state tuition has increased by $2,399 since 2004 and out-of-state tuition has increased by $5,172.  Average loan debt for bachelor’s degree earners decreased 13.4 percent, from $35,889 in 2012 to $31,085 in 2013. The five-year trend in loan debt shows an increase of 0.5 percent from the $30,937 figure in 2009.  First-time, full-time retention rates have declined 1.4 percentage points at four- year public institutions from 76.1 percent in 2009 to 74.7 percent in 2013.

32

slide-35
SLIDE 35

 In 2013, 48.6 percent of first-time freshmen took at least 30 hours within their first year

  • f enrollment. This represents a 2.6 percentage point increase over 2012 (46 percent) and

4.6 percentage point increase over 2009 (44.2 percent).  Four-year graduation rates have increased 1.6 percentage points from 21.9 percent for the 2009 cohort to 23.5 percent for the 2010 cohort. This represents a 1.3 percent increase from the 22.2 percent reported for the 2006 cohort.  Six-year graduation rates declined at four-year public institutions from 47.8 percent for the 2004 cohort to 46.6 percent for the 2008 cohort, a decrease of 1.2 percentage points.  The total number of degrees and credentials awarded at West Virginia four-year public colleges and universities in academic year 2013-14 was 13,316, which was 3.0 percent higher than the 2012-13 figure of 12,927. Community and Technical College System Highlights  The proportion of students who returned to a system institution in the fall of 2013 after initial enrollment in the academic year 2012-13 was 41.9 percent. This was 1.1 percentage points higher than the 40.8 rate for the previous year’s cohort.  The number of certificates and degrees awarded in the Community and Technical College System increased 17.1 percent from 4,011 in 2012-13 to 4,696 in 2013-14. Over the five- year period since 2009-10, the number of certificates and degrees conferred increased by 57.1 percent.  The numbers of skill enhancement completers decreased 27.8 percent from 2012 to 2013 while the number of skill set and advanced skill set completers increased 24 and 101.6 percent, respectively.  Since 2009, the number of certificate completers has increased from 535 to 1,036, a growth of 93.6 percent. The number of those completing certificates has increased at seven of the ten institutions during this time and decreased at three institutions.  The number of students completing career-technical associate’s programs increased 6.5 percent from 2,409 in 2012 to 2,565 in 2013.  The total number of training contact hours delivered in the Community and Technical College System increased 4.9 percent, from 867,540 in 2012 to 909,539 in 2013.  The six-year graduation rate for students who began in the fall of 2008 was 26.2 percent, a 2.2 percentage point increase over the completion rate for the fall 2007 cohort.  Students enrolled in for-credit classes decreased 4.4 percent, from 24,999 in 2012 to 23,896 in 2013. For-credit enrollment has decreased 7.7 percent since fall 2009.

33

slide-36
SLIDE 36

 Adult students enrolled in for-credit classes decreased 9.3 percent, from 9,000 in 2012 to 8,167 in 2013. Adult, for-credit enrollment has decreased 11.7 percent since fall 2009.  The percentage of students enrolled in developmental education courses decreased 2.2 percentage points from 62.7 percent in 2012 to 60.5 percent in 2013. The percentage of students enrolled in developmental education courses in 2013 decreased 3.7 percentage points from 2009.  The proportion of students passing developmental math courses increased by 10 percentage points from 49.6 percent in 2012 to 59.6 percent in 2013. When compared to passing rates in 2009, the proportion increased 3.2 percentage points.  The percentage of students passing English/writing developmental education courses increased 1.7 percentage points from 63.9 percent in 2012 to 65.6 percent in 2013. The percentage of students passing increased 7.4 percentage points compared with the 2009 rate of 58.2 percent. For additional measures and information, please reference the Report Card’s table of contents, as well as “About the 2014 Report Card” section found on page 4.

34

slide-37
SLIDE 37

Report to the Legislative Oversight Commission

  • n Education Accountability

January 11, 2015 Capital Project Priorities

35

slide-38
SLIDE 38

36

slide-39
SLIDE 39

MEMORANDUM TO: Legislative Oversight Commission on Education Accountability FROM: Paul L. Hill James L. Skidmore DATE: January 11, 2015 RE: Capital Project Priorities The West Virginia Higher Education Policy Commission (Commission) and the West Virginia Council for Community and Technical College Education (Council) are required by West Virginia Code §18B-19-5 to “establish a formal process for identifying needs for capital investments and for determining priorities for these investments.” The Code also requires the Commission and Council to report to the Legislature and the Legislative Oversight Commission

  • n Education Accountability in January on its priorities for capital investments.

At their respective meetings on November 21 and December 18, 2014, the Commission and Council approved a joint capital project request for one-time funding of $10 million for high priority code compliance, energy savings and deferred maintenance projects. If this request is successful and funds appropriated, the funding split would be 80 percent for Commission institutions and 20 percent for Council institutions. As in past years, the process used to develop this list of capital projects began in August and is summarized as follows:  Institutions submitted their capital requests to the Commission and Council in late August;  These requests were submitted to the State Budget Office on September 2, 2014 as part of the Commission’s and Council’s Fiscal Year 2015 appropriation requests; and  Staff used the institutions’ capital appropriation requests to generate the list of prioritized capital projects in Tables 1 and 2.

West Virginia Higher Education Policy Commission West Virginia Community and Technical College System

1018 Kanawha Boulevard, East, Suite 700 Charleston, West Virginia 25301

Paul L. Hill, Ph.D.

Chancellor

Bruce L. Berry, M.D.

Chair

James L. Skidmore

Chancellor

Clarence “Butch” Pennington

Chair (304) 558-2101 www.hepc.wvnet.edu www.wvctcs.org

37

slide-40
SLIDE 40

Table 1 identifies the highest priority four-year institution Education & General (E&G) Health, Life Safety, ADA, Energy and Deferred Maintenance Projects recommended for funding which total approximately $16 million. These projects would be funded on a 50/50 basis, 50 percent from State funding and 50 percent funded by the institutions, if the Legislature appropriates the $8 million in one-time funding requested for the Commission’s projects. The projects in Table 2 are the highest priority two-year institution E&G Health, Life Safety, ADA, Energy and Deferred Maintenance Projects recommended for funding which total approximately $3.33 million. These projects would be funded on a 60/40 basis, 60 percent from State funding and 40 percent from institution funding. The 60/40 split for the two-year institutions recognizes the fact that the community and technical colleges collect far less in capital fees than the four-year institutions and, as a result, cannot readily match State funding on a 50/50 basis.

38

slide-41
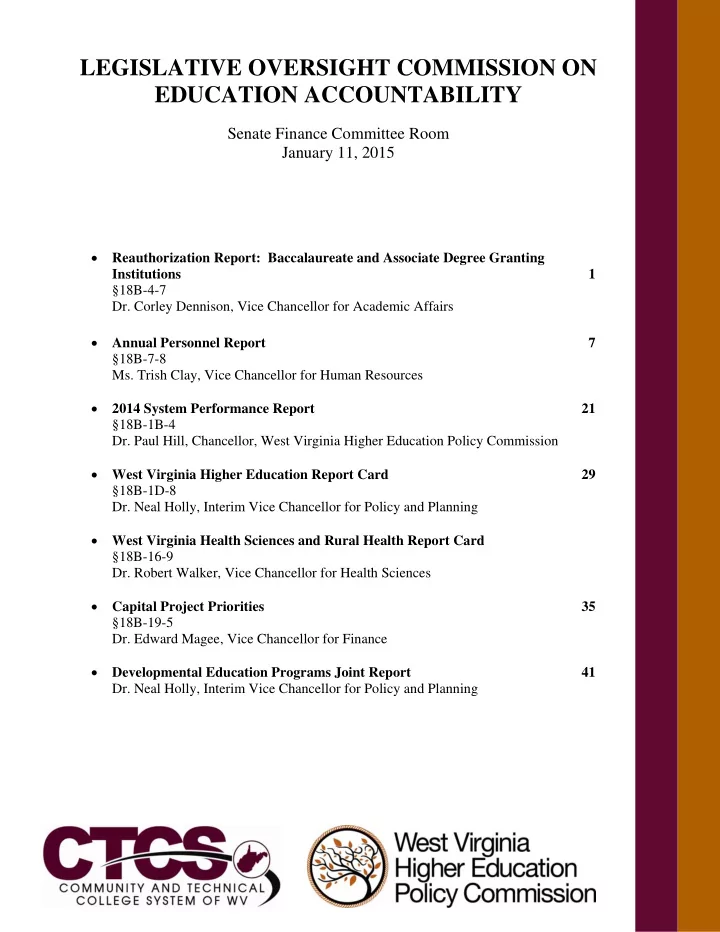
SLIDE 41

TABLE 1 WEST VIRGINIA HIGHER EDUCATION POLICY COMMISSION FISCAL YEAR 2016 CAPITAL PROJECT PRIORITIES HIGH PRIORITY CAPITAL PROJECTS Institution and Project Priority Capital Project Total Requested Institution Match HEPC Match Higher Education Policy Commission $16,000,000 $8,000,000 $8,000,000 BLUEFIELD STATE COLLEGE 600,000 300,000 300,000 6 CAMPUS KEY REPLACEMENT 600,000 300,000 300,000 CONCORD UNIVERSITY 225,000 112,500 112,500 4 E&G Storage Bldg. 225,000 112,500 112,500 FAIRMONT STATE UNIVERSITY 3,060,000 1,530,000 1,530,000 7 MUSICK LIBRARY ELEVATOR UPGRADES 150,000 75,000 75,000 8 FACILITIES‐CAMPUS SECURITY PARKING OFFICE EXPANSION 160,000 80,000 80,000 13 CAMPUS WIDE‐CAMERA SECURITY SYSTEM 350,000 175,000 175,000 15 HUNT HAUGHT HALL ROOF RENEWAL 400,000 200,000 200,000 16 MUSICK LIBRARY ROOF RENEWAL 450,000 225,000 225,000 25 MUSICK LIBRARY MULTI MEDIA SEATING RENOVATIONS 150,000 75,000 75,000 32 JAYNES HALL FIRE ALARM SYSTEM UPGRADE 400,000 200,000 200,000 35 MERCHANT STREET SPRINKLER SYSTEM 500,000 250,000 250,000 36 PEDESTRIAN STEPS BETWEEN HARDWAY AND TURLEY 500,000 250,000 250,000 GLENVILLE STATE COLLEGE 1,325,000 662,500 662,500 1 RENOVATE PICKENS HALL 175,000 87,500 87,500 7 CAMPUSWIDE LIGHTING UPGRADES 150,000 75,000 75,000 8 SIDEWALK AND PAVER REPLACEMENT 500,000 250,000 250,000 12 HANDRAIL REPLACEMENT 500,000 250,000 250,000 MARSHALL UNIVERSITY 900,000 450,000 450,000 16 MORROW ADA ELEVATOR/RENOVATIONS 900,000 450,000 450,000 SHEPHERD UNIVERSITY 1,050,000 525,000 525,000 2 EMERGENCY EGRESS LIGHTING 175,000 87,500 87,500 3 SECURITY CAMERAS 250,000 125,000 125,000 4 BUTCHER CENTER ELEVATOR REPLACEMENT 175,000 87,500 87,500 5 INTERIOR AND EXTERIOR DOOR LOCKS 250,000 125,000 125,000 8 PEDESTRIAN ACCESS SIDEWALKS 200,000 100,000 100,000 WEST LIBERTY UNIVERSITY 950,000 475,000 475,000 5 LIBRARY ELEVATOR 150,000 75,000 75,000 13 MYERS MAINTENANCE BUILDING ROOF 150,000 75,000 75,000 14 LIBRARY WINDOW REPLACEMENT 250,000 125,000 125,000 15 LIBRARY PARKING LOT 400,000 200,000 200,000 WEST VIRGINIA STATE UNIVERSITY 925,000 462,500 462,500 17 UPGRADE CAMPUS ELEVATORS TO ADA AND FIRE MARSHALL STANDARD 150,000 75,000 75,000 20 CAPITOL CENTER SPRINKLER SYSTEM 300,000 150,000 150,000 23 SULLIVAN HALL EAST ELEVATOR REPLACEMENT 225,000 112,500 112,500 27 CAPITOL CENTER ELEVATOR UPGRADE TO ADA CODE 250,000 125,000 125,000 WEST VIRGINIA UNIVERSITY 6,965,000 3,482,500 3,482,500 12 ENGINEERING LABREPLACE ELEVATORADA UPGRADES (WVUIT) 300,000 150,000 150,000 14 ADMISSIONS & RECORDS FIRE ALARM & SPRINKLER SYSTEM 450,000 225,000 225,000 26 STEWART HALL SPRINKLERS 600,000 300,000 300,000 27 STANSBURY HALL UPGRADE FIRE ALARM SYSTEM 500,000 250,000 250,000 30 CHITWOOD FIRE ALARM UPGRADE 500,000 250,000 250,000 31 AG SCIENCE ANNEX ROOF REPLACEMENT 550,000 275,000 275,000 32 WOODBURN FIRE ALARM UPGRADE 500,000 250,000 250,000 33 CHURCH MCKEE ARTS CENTER STAGE FIRE CURTAINS (PSC) 350,000 175,000 175,000 34 PURITAIN HOUSE FIRE ALARM UPGRADE 300,000 150,000 150,000 43 EVANSDALE LIBRARY FIRE ALARM UPGRADE 500,000 250,000 250,000 46 REPLACE HALON FIRE PROTECTION SYSTEM IN CLARK HALL 200,000 100,000 100,000 50 EQUINE EDUCATION FACILITY FIRE PUMP, SPRINKLER, AND FIRE AL 300,000 150,000 150,000 52 UPGRADE SPRINKLER/FIRE ALARM AG SCIENCE ANNEX 400,000 200,000 200,000 53 KNAPP HALL FIRE ALARM SYSTEM UPGRADE 500,000 250,000 250,000 54 EVANSDALE LIBRARY ROOF REPLACEMENT 410,000 205,000 205,000 59 CAMPUS EXTERIOR LIGHTINGGROUNDS LIGHTING (PSC) 225,000 112,500 112,500 62 VINING LIBRARYADA UPGRADES (WVUIT) 55,000 27,500 27,500 68 BAISI CENTER ‐ INSTALL CODE COMPLIANT FIRE DOORS (WVUIT) 175,000 87,500 87,500 75 BAISI CENTER‐CLASSROOM BUILDING‐ADA BLEACHER INSTALL (WVUIT) 150,000 75,000 75,000 Grand Total $16,000,000 $8,000,000 $8,000,000

39

slide-42
SLIDE 42

Table 2 COMMUNITY AND TECHNICAL COLLEGE SYSTEM OF WEST VIRGINIA FISCAL YEAR 2016 CAPITAL PROJECT PRIORITIES HIGH PRIORITY CAPITAL PROJECTS Institution Priority Project Total Requested Institutional Match Council Match Running Total Council Match 2 TURNING LANE FOR WV ROUTET 45 & CAMPUS IMPROVEMENTS $450,000 $180,000 $270,000 $270,000 1 SECURITY SYSTEM FOR REMAINING CAMPUS BUILDINGS ‐ MONTGOMERY & SOUTH CHARLESTON CAMPUSES $200,000 $80,000 $120,000 $390,000 2 SAFETY UPGRADES & OTHER IMPROVEMENTS MONTGOMERY CAMPUS ‐ HEATING WESTMORELAND BAY $90,333 $36,133 $54,200 $444,200 2 UPDATE TECHNOLOGY CENTER ‐ WINDOWS, LIGHTING AND HVAC $375,000 $150,000 $225,000 $669,200 1 CHILLER TOWER UPGRADE $200,000 $80,000 $120,000 $789,200 4 FURNITURE FOR NEW RALEIGH COUNTY CAMPUS $195,000 $78,000 $117,000 $906,200 5 FURNITURE FOR GREENBRIER VALLEY CAMPUS ARTS & SCIENCES BUILDING $195,000 $78,000 $117,000 $1,023,200 1 ADVANCED TECHNOLOGY CENTER ‐ 3RD FLOOR COMPETITION $650,000 $260,000 $390,000 $1,413,200 1 LOGAN CAMPUS BUILDING A REPLACE SPRINKLERS $403,000 $161,200 $241,800 $1,655,000 1 RESURFACE WESCO AND 19TH STREET PARKING LOT $150,000 $60,000 $90,000 $1,745,000 2 RESURFACE APPLIED TECHNOLOGY CENTER PARKING LOT $125,000 $50,000 $75,000 $1,820,000 2 ACTIVITIES WING ROOF REPLACEMENT $300,000 $120,000 $180,000 $2,000,000 TOTAL $3,333,333 $1,333,333 $2,000,000 INSTITUTION Total Requested Institutional Match Council Match BLUE RIDGE COMMUNITY AND TEHCNICAL COLLEGE (BRCTC) $450,000 $180,000 $270,000 BRIDGE VALLEY COMMUNITY AND TECHNICAL COLLEGE (BVCTC) $290,333 $116,133 $174,200 EASTERN WEST VIRGINIA COMMUNITY AND TECHNICAL COLLEGE (EWVCTC) $375,000 $150,000 $225,000 MOUNTWEST COMMUNITY AND TECHNICAL COLLEGE (MCTC) $200,000 $80,000 $120,000 NEW RIVER COMMUNITY AND TECHNICAL COLLEGE (NRCTC) $390,000 $156,000 $234,000 PIERPONT COMMUNITY AND TECHNICAL COLLEGE (PCTC) $650,000 $260,000 $390,000 SOUTHERN WEST VIRGINIA COMMUNITY AND TECHNICAL COLEGE (SWVCTC) $403,000 $161,200 $241,800 WEST VIRGINIA NORTHERN COMMUNITY COLLEGE (WVNCC) $275,000 $110,000 $165,000 WEST VIRGINIA UNVIVERSITY AT PARKERSBURG (WVUP) $300,000 $12,000 $180,000 TOTAL $3,333,333 $1,225,333 $2,000,000

40

slide-43
SLIDE 43

Report to the Legislative Oversight Commission

  • n Education Accountability

January 11, 2015 Development Education Programs Joint Report

41

slide-44
SLIDE 44

42

slide-45
SLIDE 45

MEMORANDUM TO: Legislative Oversight Commission on Education Accountability FROM: Paul L. Hill James L. Skidmore DATE: December 23, 2014 RE: Developmental Education Programs Joint Report In accordance with the Resolution Supporting the Complete College America Completion and Outcomes-Based Funding Initiative, this report will discuss “various higher education developmental education practices and outcomes at West Virginia two-year and four-year institutions.” The developmental education data in this report is disaggregated by total developmental education enrollment, developmental education enrollment by delivery type, success of developmental education students, and developmental education student credit hour

  • accumulation. Along with the reported data, there is also information pertaining to

developmental education benchmarks, transfer policies, and initiatives to improve graduation rates. Both the West Virginia Higher Education Policy Commission (Commission) and the West Virginia Council for Community and Technical College Education (Council) are committed to increasing the success of students requiring developmental education. Recently, both systems have implemented initiatives or goals centered on developmental education. In 2013 Chancellor Skidmore issued a challenge to all public two-year institutions across West Virginia to phase out traditional forms of developmental education delivery and primarily offer co-requisite developmental education courses. Co-requisite developmental education enrolls students in college-level courses with the additional support needed for students to be successful with college-level coursework and has been shown to increase the success of students who require developmental education. By the fall of 2014, 70 percent of students requiring developmental education were enrolled in a co-requisite course.

West Virginia Higher Education Policy Commission West Virginia Community and Technical College System

1018 Kanawha Boulevard, East, Suite 700 Charleston, West Virginia 25301

Paul L. Hill, Ph.D.

Chancellor

Bruce L. Berry, M.D.

Chair

James L. Skidmore

Chancellor

Clarence “Butch” Pennington

Chair (304) 558-2101 www.hepc.wvnet.edu www.wvctcs.org

43

slide-46
SLIDE 46

Across the four-year system, there are six institutions that offer some form of co-requisite remediation and one that is fully modular delivery method. The Commission’s 2013-2018 Master Plan Leading the Way Access. Success. Impact. sets system-wide goals for member institutions to work toward by 2018. In an effort to improve the outcomes of students requiring developmental education, the system goal is to increase the percentage of first-time freshmen passing developmental education courses in mathematics to 70 percent and in English/writing to 75 percent. Furthermore, the system has set goals of 60 percent and 70 percent for the percentage

  • f students requiring developmental education courses and passing the first related college-level

math or English/writing courses, respectively. As developmental education continues to play an important role in the success of students across West Virginia, both the Commission and Council are actively working with member institutions to ensure quality data submissions. However, because additional developmental education data metrics, such as form of delivery, are relatively new, institutional reporting practices are continuing to mature. This maturation process will, over time, result in a clearer picture of developmental education, especially concerning test scores and delivery methods. Recommendations to Increase Graduation Rates The Commission and Council serve a very diverse range of students working to earn different types of degrees. Typically, students entering Commission institutions are previous year high school graduates seeking a bachelor’s degree, while a larger population of those entering Council institutions are adults or returning students seeking a certificate or associate’s degree. Because of these differences in student populations and requirements to earn a credential, initiatives to increase graduation rates vary between the systems. Commission In August 2014 the Commission began to roll out a system-wide informational campaign on college and university campuses encouraging students to graduate within four years. In order to earn the 120 credit hours required to receive a bachelor’s degree in West Virginia on time, students must enroll in at least 15 credit hours per semester. However, this schedule is in conflict with the federal full-time definition of 12 credit hours that is used for financial aid purposes. For students who enroll in 12 hours per semester, it would take them at least five years to complete a bachelor’s degree. Not only does taking a 15 credit hour full course load increase the likelihood that a student will graduate on time, research has shown taking 15 credit hours actually improves academic

  • utcomes. In addition, research has shown it reduces student loan debt, saves students money on

tuition and related expenses, and improves their employment prospects by allowing them to begin their professional careers as soon as possible. Council In 2013, 58.6 percent of first-time freshmen at community and technical colleges across the state enrolled in at least one English or math developmental education course. Nationally this figure is 51.7 percent. Students who enroll in these courses are some of the least likely to graduate with any credential. Because of this, the Council has been actively working to reform developmental education across the system. As mentioned previously, by the end of the 2014 academic year, all

44

slide-47
SLIDE 47

public two-year institutions across the state will be offering a co-requisite delivery method of developmental education. This form of developmental education has been shown to be successful across the country at institutions where it has been implemented. For example, at Austin Peay State University, student success doubled with the introduction of co-requisite

  • remediation. When students receive credit for both the developmental and college-level course, it

reduces an additional barrier to success and time to degree. Program Appropriate Mathematics Courses Historically, students who have tested into developmental education have been subject to attaining mathematics proficiency in algebraic functions as a prerequisite to entering courses in their desired field of study. This has resulted in students potentially enrolling in three levels of developmental mathematics before they are able to enroll in their major courses. This long sequence of course taking has been shown to cause students to stop out of college before their college career has even really begun. What is more troubling about this sequence, is that the level of mathematics proficiency expected of developmental education students, is appropriate

  • nly for students enrolling in a very select group of STEM majors. Research from the Charles
  • A. Dana Center and the Carnegie Foundation, has found that statistics and quantitative reasoning

courses are far more useful and applicable to students in most majors than the current placement standard of Algebra I. As a result of this work, many states, have begun to adopt math pathways for college students. Math pathways are program specific math courses that are closely aligned with students majors. Math pathways eliminate a major obstacle to degree completion and reduce the total number of credit hours a student must attempt to graduate. These courses teach students a very specific subset of germane mathematic principles directly and immediately applicable to their field of study. Throughout the State, four- and two-year institutions are implementing these pathways to better serve our students. College math courses including general math, algebra, trigonometry, or calculus can be transferred to any public institution in the state and can, at minimum, be applied to general studies requirements. Currently, there are over one hundred mathematics courses spanning institutions in both state systems that are fully transferable between all public institutions in the state. Key Data Findings In an effort to conserve space, all key findings are reflective of state trends. Please see individual tables for institution-level data.  In fall 2013, 31.8 percent of First-Time Freshmen enrolled in a developmental education

  • course. This percentage was higher for First-Time Freshmen who received a Pell grant at

45.7 percent, and even higher for First-Time Freshmen adult students, 55.3 percent.  Statewide, approximately 45.8 percent of First-Time Freshmen test scores indicated a need for developmental education, as defined in Procedural Rule, Series 21, Freshmen Assessment and Placement Standards. Though Shepherd University and West Virginia University do not offer traditional developmental education, approximately 49.1 percent and 25 percent of First-Time Freshmen at those institutions, respectively, received test scores requiring developmental education.

45

slide-48
SLIDE 48

 In fall 2013, of the 7,277 students enrolled in mathematics developmental education, 75 percent were enrolled in a traditional delivery course, 0.8 percent in a co-requisite course, and 23.7 percent in a different method. Of the 3,026 students enrolled in English/writing developmental education, 89.6 percent were enrolled in a traditional delivery course and 11.8 percent in a co-requisite course.  Just over 72 percent of adult students and 75.7 percent of Pell recipients enrolled in mathematics developmental education were enrolled in a traditional form of delivery. For both adults and Pell recipients, these percentages were higher in English/writing at 99 and 92.8 percent, respectively.  Across the state, 16.2 percent of first-time freshmen who in enrolled in mathematics developmental education during the 2013 academic year passed a corresponding college- level course within one year. This percentage was higher for those enrolling in an English/writing developmental education course and passing the college-level course at 47.4 percent.  Of all adults who enrolled in developmental education during the 2013 academic year, 10.5 percent passed a corresponding college-level course within one year. This percentage was higher for those enrolling in an English/writing developmental education course and passing the college-level course at 31.3 percent.  Of all Pell recipients who enrolled in developmental education during the 2013 academic year, 14.2 percent passed a corresponding college-level course within one year. This percentage was higher for those enrolling in an English/writing developmental education course and passing the college-level course at 42 percent.  At Commission institutions, students in the 2006 cohort requiring developmental education and graduating within 150 percent time (six years) accumulated 140.74 credit hours on average; while those graduating at Council institutions within 150 percent time (three years) accumulated 74.21 credits on average.  At Commission institutions, adults in the 2006 cohort requiring developmental education and graduating within 150 percent time (six years) accumulated 140.14 credit hours on average; while those graduating at Council institutions within 150 percent time (three years), accumulated 67.29 credit hours on average.  At Commission institutions, Pell recipients in the 2006 cohort requiring developmental education and graduating within 150 percent time (six years) accumulated 142.44 credit hours on average; while those graduating at Council institutions within 150 percent time (three years) accumulated 77.01 credit hours on average.

46

slide-49
SLIDE 49

Table 1.1.1 Proportion of First-Time Freshmen Requiring Any Form Developmental Education, Fall 2013 Institution Total First-Time Freshmen Enrollment Enrolled in Developmental Education

HEPC Total

11,188 21.7%

Bluefield State College

303 52.1%

Concord University

514 48.1%

Fairmont State University

749 33.1%

Glenville State College

304 62.5%

Marshall University

1,871 26.1%

Potomac State College of WVU

631 78.0%

Shepherd University

684 N/A

West Liberty University

501 55.5%

West Virginia University

4,912 N/A

West Virginia State University

416 35.3%

WVU Institute of Technology

303 51.2%

CTCS Total

4,222 58.6%

Blue Ridge Community and Technical College

482 53.3%

Bridgemont Community and Technical College

162 77.2%

Eastern WV Community and Technical College

86 68.6%

Kanawha Valley Community and Technical College

310 78.1%

Mountwest Community and Technical College

536 29.7%

New River Community and Technical College

639 69.0%

Pierpont Community and Technical College

573 56.0%

Southern WV Community and Technical College

558 65.2%

WV Northern Community College

333 52.3%

WVU at Parkersburg

543 61.0%

State Total

15,410 31.8%

.

47

slide-50
SLIDE 50

Table 1.2 Proportion of First-Time Freshmen Adult Students (25 or older) Requiring Any Form of Developmental Education, Fall 2013 Institution Total First-Time Freshmen Adult Enrollment Enrolled in Developmental Education

HEPC Total

283 45.6%

Bluefield State College

43 72.1%

Concord University

19 57.9%

Fairmont State University

35 68.6%

Glenville State College

29 6.9%

Marshall University

36 41.7%

Potomac State College of WVU

20 90.0%

Shepherd University

17 N/A

West Liberty University

5 20.0%

West Virginia University

28 N/A

West Virginia State University

37 48.6%

WVU Institute of Technology

14 28.6%

CTCS Total

1,087 57.8%

Blue Ridge Community and Technical College

137 51.1%

Bridgemont Community and Technical College

22 54.5%

Eastern WV Community and Technical College

37 75.7%

Kanawha Valley Community and Technical College

107 80.4%

Mountwest Community and Technical College

185 25.9%

New River Community and Technical College

192 72.9%

Pierpont Community and Technical College

107 56.1%

Southern WV Community and Technical College

106 60.4%

WV Northern Community College

89 60.7%

WVU at Parkersburg

105 62.9%

State Total

1,370 55.3%

48

slide-51
SLIDE 51

Table 1.3 Proportion of First-Time-Freshmen Pell-Recipients Requiring Any form of Developmental Education, Fall 2013 Institution Total First Time-Freshmen Enrollment Enrolled in Developmental Education

HEPC Total

4,318 33.2%

Bluefield State College

179 58.1%

Concord University

251 55.8%

Fairmont State University

360 38.6%

Glenville State College

169 74.6%

Marshall University

833 34.2%

Potomac State College of WVU

377 81.7%

Shepherd University

240 N/A

West Liberty University

229 62.0%

West Virginia University

1,312 N/A

West Virginia State University

218 40.4%

WVU Institute of Technology

150 60.0%

CTCS Total

2,732 65.6%

Blue Ridge Community and Technical College

308 58.4%

Bridgemont Community and Technical College

89 80.9%

Eastern WV Community and Technical College

72 66.7%

Kanawha Valley Community and Technical College

220 81.8%

Mountwest Community and Technical College

309 39.5%

New River Community and Technical College

471 71.5%

Pierpont Community and Technical College

368 64.1%

Southern WV Community and Technical College

360 73.6%

WV Northern Community College

213 59.6%

WVU at Parkersburg

322 70.2%

State Total

7,050 45.7%

49

slide-52
SLIDE 52

Table 2.1.1 Proportion of Students Requiring Developmental Math Education by Delivery Type, Fall 2013 Institution Number of students who enrolled in Math Developmental Education Enrolled in Traditional Delivery Enrolled in Co- Requisite Model Enrolled in Other

HEPC Total

3,169 86.8% 0.0% 13.2%

Bluefield State College

205 100.0% 0.0% 0.0%

Concord University

330 100.0% 0.0% 0.0%

Fairmont State University

418 0.0% 0.0% 100.0%

Glenville State College

310 100.0% 0.0% 0.0%

Marshall University

671 100.0% 0.0% 0.0%

Potomac State College of WVU

650 100.0% 0.0% 0.0%

Shepherd University

N/A N/A N/A N/A

West Liberty University

205 100.0% 0.0% 0.0%

West Virginia University

N/A N/A N/A N/A

West Virginia State University

207 100.0% 0.0% 0.0%

WVU Institute of Technology

151 100.0% 0.0% 0.0%

CTCS Total

4,108 66.8% 1.5% 31.8%

Blue Ridge Community and Technical College

477 92.2% 0.0% 8.0%

Bridgemont Community and Technical College

163 63.2% 36.8% 0.0%

Eastern WV Community and Technical College

192 100.0% 0.0% 0.0%

Kanawha Valley Community and Technical College

425 100.0% 0.0% 0.0%

Mountwest Community and Technical College

107 100.0% 0.0% 0.0%

New River Community and Technical College

635 100.0% 0.0% 0.0%

Pierpont Community and Technical College

578 0.0% 0.0% 100.0%

Southern WV Community and Technical College

566 100.0% 0.0% 0.0%

WV Northern Community College

442 62.7% 0.0% 37.6%

WVU at Parkersburg

523 0.0% 0.0% 100.0%

State Total

7,277 75.5% 0.8% 23.7%

50

slide-53
SLIDE 53

Table 2.1.2 Proportion of Students Requiring Developmental English Education by Delivery Type, Fall 2013 Institution Number of students who enrolled in English Developmental Education Enrolled in Traditional Delivery Enrolled in Co- Requisite Model Enrolled in Other

HEPC Total

1,424 79.7% 21.3% 0.0%

Bluefield State College

106 100.0% 0.0% 0.0%

Concord University

134 100.0% 0.0% 0.0%

Fairmont State University

133 92.5% 18.0% 0.0%

Glenville State College

114 100.0% 0.0% 0.0%

Marshall University

201 100.0% 0.0% 0.0%

Potomac State College of WVU

310 100.0% 0.0% 0.0%

Shepherd University

N/A N/A N/A N/A

West Liberty University

261 0.0% 100.0% 0.0%

West Virginia University

N/A N/A N/A N/A

West Virginia State University

69 73.9% 26.1% 0.0%

WVU Institute of Technology

96 100.0% 0.0% 0.0%

CTCS Total

1,602 98.3% 3.4% 0.1%

Blue Ridge Community and Technical College

165 99.4% 0.0% 0.6%

Bridgemont Community and Technical College

90 77.8% 22.2% 0.0%

Eastern WV Community and Technical College

57 100.0% 0.0% 0.0%

Kanawha Valley Community and Technical College

93 100.0% 0.0% 0.0%

Mountwest Community and Technical College

215 100.0% 0.0% 0.0%

New River Community and Technical College

249 100.0% 0.0% 0.0%

Pierpont Community and Technical College

299 98.0% 11.4% 0.0%

Southern WV Community and Technical College

232 100.0% 0.0% 0.0%

WV Northern Community College

82 100.0% 0.0% 0.0%

WVU at Parkersburg

120 100.0% 0.0% 0.0%

State Total

3,026 89.6% 11.8% 0.0%

51

slide-54
SLIDE 54

Table 2.2.1 Proportion of Adults Requiring Developmental Math Education by Delivery Type, Fall 2013 Institution Number of students who enrolled in Math Developmental Education Enrolled in Traditional Delivery Enrolled in Co- Requisite Model Enrolled in Other

HEPC Total

1,583 77.8% 0.0% 22.2%

Bluefield State College

239 100.0% 0.0% 0.0%

Concord University

133 100.0% 0.0% 0.0%

Fairmont State University

352 0.0% 0.0% 100.0%

Glenville State College

99 100.0% 0.0% 0.0%

Marshall University

360 100.0% 0.0% 0.0%

Potomac State College of WVU

177 100.0% 0.0% 0.0%

Shepherd University

N/A N/A N/A N/A

West Liberty University

15 100.0% 0.0% 0.0%

West Virginia University

N/A N/A N/A N/A

West Virginia State University

140 100.0% 0.0% 0.0%

WVU Institute of Technology

48 100.0% 0.0% 0.0%

CTCS Total

5,340 70.8% 0.9% 28.3%

Blue Ridge Community and Technical College

824 91.6% 0.0% 8.4%

Bridgemont Community and Technical College

87 46.0% 54.0% 0.0%

Eastern WV Community and Technical College

431 100.0% 0.0% 0.0%

Kanawha Valley Community and Technical College

705 100.0% 0.0% 0.0%

Mountwest Community and Technical College

167 100.0% 0.0% 0.0%

New River Community and Technical College

821 100.0% 0.0% 0.0%

Pierpont Community and Technical College

667 0.0% 0.0% 100.0%

Southern WV Community and Technical College

442 100.0% 0.0% 0.0%

WV Northern Community College

665 63.2% 0.0% 36.8%

WVU at Parkersburg

531 0.0% 0.0% 100.0%

State Total

6,923 72.4% 0.7% 26.9%

52

slide-55
SLIDE 55

Table 2.2.2 Proportion of Adults Requiring Developmental English Education by Delivery Type, Fall 2013 Institution Number of students who enrolled in English Developmental Education Enrolled in Traditional Delivery Enrolled in Co- Requisite Model Enrolled in Other

HEPC Total

118 97.5% 3.4% 0.0%

Bluefield State College

28 100.0% 0.0% 0.0%

Concord University

9 100.0% 0.0% 0.0%

Fairmont State University

18 94.4% 11.1% 0.0%

Glenville State College

3 100.0% 0.0% 0.0%

Marshall University

25 100.0% 0.0% 0.0%

Potomac State College of WVU

21 100.0% 0.0% 0.0%

Shepherd University

N/A N/A N/A N/A

West Liberty University

1 0.0% 100.0% 0.0%

West Virginia University

N/A N/A N/A N/A

West Virginia State University

12 91.7% 8.3% 0.0%

WVU Institute of Technology

1 100.0% 0.0% 0.0%

CTCS Total

457 99.3% 1.1% 0.2%

Blue Ridge Community and Technical College

45 97.8% 0.0% 2.2%

Bridgemont Community and Technical College

8 87.5% 12.5% 0.0%

Eastern WV Community and Technical College

27 100.0% 0.0% 0.0%

Kanawha Valley Community and Technical College

29 100.0% 0.0% 0.0%

Mountwest Community and Technical College

74 100.0% 0.0% 0.0%

New River Community and Technical College

78 100.0% 0.0% 0.0%

Pierpont Community and Technical College

77 98.7% 5.2% 0.0%

Southern WV Community and Technical College

55 100.0% 0.0% 0.0%

WV Northern Community College

34 100.0% 0.0% 0.0%

WVU at Parkersburg

30 100.0% 0.0% 0.0%

State Total

575 99.0% 1.6% 0.2%

53

slide-56
SLIDE 56

Table 2.3.1 Proportion of Pell Recipients Requiring Developmental Math Education by Delivery Type, Fall 2013 Institution Number of students who enrolled in Math Developmental Education Enrolled in Traditional Delivery Enrolled in Co- Requisite Model Enrolled in Other

HEPC Total

1,984 88.1% 0.0% 11.9%

Bluefield State College

141 100.0% 0.0% 0.0%

Concord University

215 100.0% 0.0% 0.0%

Fairmont State University

237 0.0% 0.0% 100.0%

Glenville State College

204 100.0% 0.0% 0.0%

Marshall University

420 100.0% 0.0% 0.0%

Potomac State College of WVU

425 100.0% 0.0% 0.0%

Shepherd University

N/A N/A N/A N/A

West Liberty University

110 100.0% 0.0% 0.0%

West Virginia University

N/A N/A N/A N/A

West Virginia State University

121 100.0% 0.0% 0.0%

WVU Institute of Technology

98 100.0% 0.0% 0.0%

CTCS Total

2,999 67.6% 1.2% 31.3%

Blue Ridge Community and Technical College

330 91.8% 0.0% 8.5%

Bridgemont Community and Technical College

104 66.3% 33.7% 0.0%

Eastern WV Community and Technical College

169 100.0% 0.0% 0.0%

Kanawha Valley Community and Technical College

315 100.0% 0.0% 0.0%

Mountwest Community and Technical College

80 100.0% 0.0% 0.0%

New River Community and Technical College

469 100.0% 0.0% 0.0%

Pierpont Community and Technical College

433 0.0% 0.0% 100.0%

Southern WV Community and Technical College

408 100.0% 0.0% 0.0%

WV Northern Community College

335 63.6% 0.0% 36.7%

WVU at Parkersburg

356 0.0% 0.0% 100.0%

State Total

4,983 75.7% 0.7% 23.6%

54

slide-57
SLIDE 57

Table 2.3.2 Proportion of Pell Recipients Requiring Developmental English Education by Delivery Type, Fall 2013 Institution Number of students who enrolled in English Developmental Education Enrolled in Traditional Delivery Enrolled in Co- Requisite Model Enrolled in Other

HEPC Total

861 84.7% 16.5% 0.0%

Bluefield State College

82 100.0% 0.0% 0.0%

Concord University

75 100.0% 0.0% 0.0%

Fairmont State University

72 87.5% 26.4% 0.0%

Glenville State College

73 100.0% 0.0% 0.0%

Marshall University

131 100.0% 0.0% 0.0%

Potomac State College of WVU

219 100.0% 0.0% 0.0%

Shepherd University

N/A N/A N/A N.A

West Liberty University

119 0.0% 100.0% 0.0%

West Virginia University

N/A N/A N/A N/A

West Virginia State University

38 89.5% 10.5% 0.0%

WVU Institute of Technology

52 100.0% 0.0% 0.0%

CTCS Total

1,208 98.6% 3.3% 0.1%

Blue Ridge Community and Technical College

122 99.2% 0.0% 0.8%

Bridgemont Community and Technical College

53 77.4% 22.6% 0.0%

Eastern WV Community and Technical College

48 100.0% 0.0% 0.0%

Kanawha Valley Community and Technical College

66 100.0% 0.0% 0.0%

Mountwest Community and Technical College

170 100.0% 0.0% 0.0%

New River Community and Technical College

184 100.0% 0.0% 0.0%

Pierpont Community and Technical College

239 98.3% 11.7% 0.0%

Southern WV Community and Technical College

171 100.0% 0.0% 0.0%

WV Northern Community College

68 100.0% 0.0% 0.0%

WVU at Parkersburg

87 100.0% 0.0% 0.0%

State Total

2,069 92.8% 8.8% 0.0%

55

slide-58
SLIDE 58

Table 3.1 Percent of First-Time Freshmen Requiring Developmental Education Passing a College-Level Course within the Same Subject Area within One Year Academic Year 2013 Students Enrolled in Developmental Education by Subject Area Passing College-Level Course within the Same Subject Area within One Year Institution Math English Math English

HEPC Total 2,257 1,301 19.8% 60.0% Bluefield State College 148 86 39.9% 45.3% Concord University 226 115 8.0% 66.1% Fairmont State University 254 115 7.9% 57.4% Glenville State College 187 101 3.7% 49.5% Marshall University 498 189 31.5% 63.5% Potomac State College of WVU 481 298 18.3% 44.0% Shepherd University

N/A N/A N/A N/A

West Liberty University 167 236 21.0% 90.7% West Virginia University

N/A N/A N/A N/A

West Virginia State University 151 68 20.5% 52.9% WVU Institute of Technology 125 93 23.2% 51.6% CTCS Total 2,385 1,380 12.7% 35.5% Blue Ridge Community and Technical College 272 144 7.0% 34.0% Bridgemont Community and Technical College 118 92 43.2% 48.9% Eastern WV Community and Technical College 55 46 1.8% 28.3% Kanawha Valley Community and Technical College 240 83 21.3% 38.6% Mountwest Community and Technical College 78 174 23.1% 33.3% New River Community and Technical College 440 228 20.5% 36.0% Pierpont Community and Technical College 308 241 2.3% 26.1% Southern WV Community and Technical College 354 208 7.9% 44.2% WV Northern Community College 192 65 3.6% 41.5% WVU at Parkersburg 328 99 9.5% 29.3% State Total 4,642 2,681 16.2% 47.4% 56

slide-59
SLIDE 59

Table 3.2 Percent of Adult Students Requiring Developmental Education Passing a College-Level Course within the Same Subject Area within One Year Academic Year 2013 Students Enrolled in Developmental Education by Subject Area Passing College-Level Course within the Same Subject Area within One Year Institution Math English Math English

HEPC Total

134 68 9.0% 32.4%

Bluefield State College

30 17 16.7% 35.3%

Concord University

11 6 0.0% 50.0%

Fairmont State University

26 9 15.4% 33.3%

Glenville State College

4 1 0.0% 100.0%

Marshall University

17 12 5.9% 41.7%

Potomac State College of WVU

18 14 0.0% 7.1%

Shepherd University

N/A N/A N/A N/A

West Liberty University

1 0.0% 0.0%

West Virginia University

N/A N/A N/A N/A

West Virginia State University

16 9 12.5% 33.3%

WVU Institute of Technology

5 0.0% 0.0%

CTCS Total

609 328 10.8% 31.1%

Blue Ridge Community and Technical College

80 30 6.3% 30.0%

Bridgemont Community and Technical College

10 7 20.0% 71.4%

Eastern WV Community and Technical College

25 20 0.0% 25.0%

Kanawha Valley Community and Technical College

84 21 26.2% 38.1%

Mountwest Community and Technical College

32 51 25.0% 33.3%

New River Community and Technical College

140 68 16.4% 32.4%

Pierpont Community and Technical College

54 50 0.0% 20.0%

Southern WV Community and Technical College

59 41 5.1% 31.7%

WV Northern Community College

60 21 3.3% 28.6%

WVU at Parkersburg

65 19 1.5% 36.8%

State Total

743 396 10.5% 31.3%

57

slide-60
SLIDE 60

Table 3.3 Percent of Pell Recipients Requiring Developmental Education Passing a College-Level Course within the Same Subject Area within One Year Academic Year 2013 Students Enrolled in Developmental Education by Subject Area Passing College- Level Course within the Same Subject Area within One Year Institution Math English Math English

HEPC Total 1,362 791 17.5% 52.8% Bluefield State College 97 66 32.0% 34.8% Concord University 133 63 5.3% 54.0% Fairmont State University 146 60 6.2% 48.3% Glenville State College 124 66 1.6% 50.0% Marshall University 289 120 29.4% 60.0% Potomac State College of WVU 306 210 15.7% 42.9% Shepherd University

N/A N/A N/A N/A

West Liberty University 87 111 26.4% 87.4% West Virginia University

N/A N/A N/A N/A

West Virginia State University 89 44 20.2% 43.2% WVU Institute of Technology 80 51 20.0% 41.2% CTCS Total 1,735 1,036 11.6% 33.8% Blue Ridge Community and Technical College 190 104 5.8% 30.8% Bridgemont Community and Technical College 71 55 42.3% 52.7% Eastern WV Community and Technical College 46 38 2.2% 34.2% Kanawha Valley Community and Technical College 180 62 20.0% 37.1% Mountwest Community and Technical College 67 137 22.4% 32.8% New River Community and Technical College 342 174 18.4% 32.2% Pierpont Community and Technical College 220 187 0.9% 22.5% Southern WV Community and Technical College 257 157 6.2% 43.9% WV Northern Community College 138 52 4.3% 40.4% WVU at Parkersburg 224 70 9.8% 28.6% State Total 3,097 1,827 14.2% 42.0% 58

slide-61
SLIDE 61

Table 4.1 Average Credit Accumulation of 150% Graduates by Developmental Education Status, 2006 Cohort Institution Graduates within 150% Time*

  • Dev. Ed

Non Dev Ed. Number Average Credits Number Average Credits

HEPC Total** 452 140.74 4,306 136.40 Bluefield State College 24 140.00 37 137.78 Concord University 88 141.98 157 136.52 Fairmont State University 56 141.55 186 142.39 Glenville State College 37 147.19 48 139.69 Marshall University 111 139.72 584 139.00 Potomac State College of WVU 38 142.34 75 140.87 Shepherd University N/A N/A 317 136.54 West Liberty University 37 136.51 117 136.48 West Virginia University N/A N/A 2,698 135.04 West Virginia State University 42 138.40 27 141.33 WVU Institute of Technology 10 141.40 60 141.12 CTCS Total** 179 74.21 227 71.09 Blue Ridge Community and Technical College 27 64.81 28 62.68 Bridgemont Community and Technical College 11 84.64 20 80.05 Eastern WV Community and Technical College 4 78.25 1 60.00 Kanawha Valley Community and Technical College 7 69.43 9 71.56 Mountwest Community and Technical College 20 79.65 21 46.67 New River Community and Technical College 16 68.38 21 65.00 Pierpont Community and Technical College 27 76.04 31 72.90 Southern WV Community and Technical College 25 79.12 40 76.05 WV Northern Community College 27 69.33 31 72.23 WVU at Parkersburg 15 80.93 25 87.64 *150 percent time at a Commission institution is 6 years and 3 years at a Council Institution ** In 2006, students working towards a bachelor’s degree were required to earn at least 128 credit hours and those working towards an associate’s degree were required to earn 60. Average credits at Commission institutions are reflective of bachelor degree earners, while those at Council institutions are reflective certificate or associate’s degree earners. Because certificates require fewer hours than associate’s, average credit accumulation at Council Institutions can drop below 60 hours. 59

slide-62
SLIDE 62

Table 4.2 Average Credit Accumulation of 150% Adult Graduates by Developmental Education Status, 2006 Cohort Institution Graduates within 150% Time*

  • Dev. Ed

Non Dev Ed. Number Average Credits Number Average Credits

HEPC Total** 14 140.14 20 135.85 Bluefield State College 3 129.00 2 73.00 Concord University 2 139.00 N/A Fairmont State University 1 143.00 N/A Glenville State College 1 134.00 N/A Marshall University 5 141.60 7 135.14 Potomac State College of WVU 3 N/A N/A Shepherd University N/A N/A 4 133.25 West Liberty University N/A N/A West Virginia University N/A 9 137.56 West Virginia State University 2 132.00 N/A WVU Institute of Technology N/A N/A CTCS Total** 59 67.29 62 55.73 Blue Ridge Community and Technical College 12 50.17 11 59.45 Bridgemont Community and Technical College N/A 3 76.00 Eastern WV Community and Technical College N/A N/A Kanawha Valley Community and Technical College 1 81.00 4 60.00 Mountwest Community and Technical College 5 81.20 13 36.23 New River Community and Technical College 6 68.67 10 54.80 Pierpont Community and Technical College 10 73.70 7 62.86 Southern WV Community and Technical College 5 75.00 2 29.50 WV Northern Community College 14 64.00 10 66.20 WVU at Parkersburg 6 76.83 2 76.50 *150 percent time at a Commission institution is 6 years and 3 years at a Council Institution ** In 2006, students working towards a bachelor’s degree were required to earn at least 128 credit hours while those working towards an associate’s degree were required to earn 60. Average credits at Commission institutions are reflective of bachelor degree earners, while those at Council institutions are reflective certificate or associate’s degree earners Because certificates require fewer hours than associate’s, average credit accumulation at Council Institutions can drop below 60 hours. 60

slide-63
SLIDE 63

Table 4.2 Average Credit Accumulation of 150% Pell Recipient Graduates by Developmental Education Status, 2006 Cohort Institution Graduates within 150% Time*

  • Dev. Ed

Non Dev. Ed Number Average Credits Number Average Credits

HEPC Total** 188 142.44 858 138.14 Bluefield State College 10 138.90 14 144.00 Concord University 35 147.31 47 136.13 Fairmont State University 18 143.11 60 141.00 Glenville State College 23 147.26 22 138.82 Marshall University 40 139.48 143 140.68 Potomac State College of WVU 19 142.42 20 141.90 Shepherd University N/A N/A 43 134.30 West Liberty University 19 139.95 28 141.39 West Virginia University 2 137.50 464 136.78 West Virginia State University 19 137.53 5 138.60 WVU Institute of Technology 3 146.00 12 145.58 CTCS Total** 80 77.01 85 70.99 Blue Ridge Community and Technical College 6 78.83 9 70.89 Bridgemont Community and Technical College 3 87.67 4 85.25 Eastern WV Community and Technical College 4 78.25 1 60.00 Kanawha Valley Community and Technical College 3 75.67 4 79.75 Mountwest Community and Technical College 11 79.91 3 50.00 New River Community and Technical College 5 69.80 9 69.22 Pierpont Community and Technical College 13 78.77 10 63.70 Southern WV Community and Technical College 16 80.13 22 66.32 WV Northern Community College 16 70.44 12 74.42 WVU at Parkersburg 3 74.67 11 83.09 *150 percent time at a Commission institution is 6 years and 3 years at a Council Institution ** In 2006, students working towards a bachelor’s degree were required to earn at least 128 credit hours and those working towards an associate’s degree were required to earn 60. Average credits at Commission institutions are reflective of bachelor degree earners, while those at Council institutions are reflective certificate or associate’s degree earners. Because certificates require fewer hours than associate’s, average credit accumulation at Council Institutions can drop below 60 hours. 61

slide-64
SLIDE 64

Table 5. Benchmarks for Students Requiring Developmental Education and Passing a College-Level Course in the Same Area within One Year Institution Passing College-Level Course within the Same Subject Area* All Students Math English

HEPC Total

60% 70%

Bluefield State College

75% 75%

Concord University

40% 60%

Fairmont State University

36% 61%

Glenville State College

32% 61%

Marshall University

40% 50%

Potomac State College of WVU

35% 56%

Shepherd University

N/A N/A

West Liberty University

40% 55%

West Virginia State University

33% 52%

West Virginia University

N/A N/A

WVU Institute of Technology

40% 60%

CTCS Total

100% 100%

Blue Ridge Community and Technical College

100% 100%

Bridgemont Community and Technical College

100% 100%

Eastern WV Community and Technical College

100% 100%

Kanawha Valley Community and Technical College

100% 100%

Mountwest Community and Technical College

100% 100%

New River Community and Technical College

100% 100%

Pierpont Community and Technical College

100% 100%

Southern WV Community and Technical College

100% 100%

WV Northern Community College

100% 100%

WVU at Parkersburg

100% 100%

*HEPC percentages come directly from institution and system 2018 Compact goals and are based off of passing the college-level course within two years, while CTCS rates are based off of passing the college-level course within one year. 62