
SLIDE 1
Lecture 29/Chapter 24
Significance vs. Importance Undetected Differences
Review Decision in z Test Factors Impacting Decision in z Test Importance of Sample Size Examples
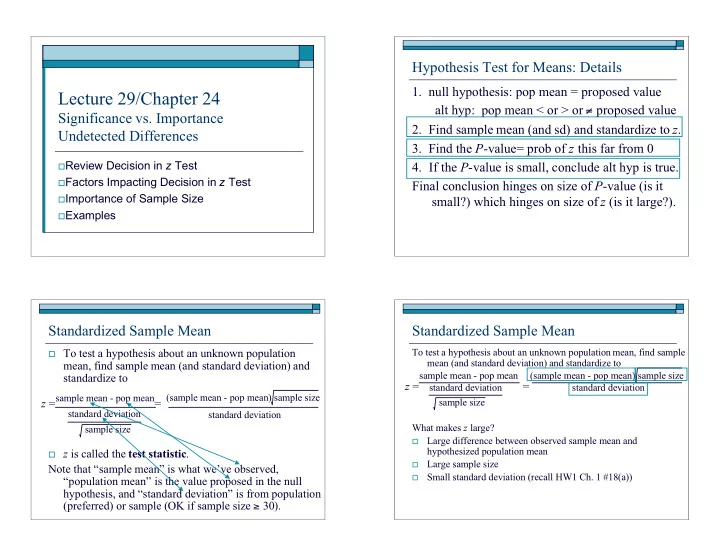
Hypothesis Test for Means: Details
- 1. null hypothesis: pop mean = proposed value
alt hyp: pop mean < or > or proposed value
- 2. Find sample mean (and sd) and standardize to z.
- 3. Find the P-value= prob of z this far from 0
- 4. If the P-value is small, conclude alt hyp is true.
Final conclusion hinges on size of P-value (is it small?) which hinges on size of z (is it large?).
Standardized Sample Mean
To test a hypothesis about an unknown population
mean, find sample mean (and standard deviation) and standardize to
z is called the test statistic.
Note that “sample mean” is what we’ve observed, “population mean” is the value proposed in the null hypothesis, and “standard deviation” is from population (preferred) or sample (OK if sample size 30).
sample size sample mean - pop mean standard deviation
z =
(sample mean - pop mean) sample size standard deviation
=
Standardized Sample Mean
To test a hypothesis about an unknown population mean, find sample mean (and standard deviation) and standardize to What makes z large?
- Large difference between observed sample mean and
hypothesized population mean
- Large sample size
- Small standard deviation (recall HW1 Ch. 1 #18(a))