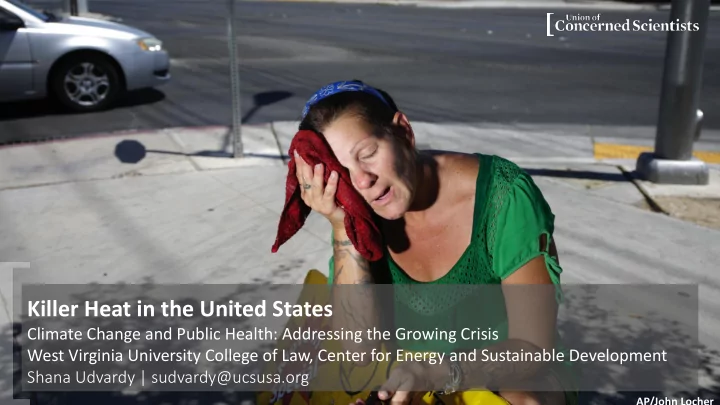
AP/John Locher
Killer Heat in the United States
Climate Change and Public Health: Addressing the Growing Crisis West Virginia University College of Law, Center for Energy and Sustainable Development Shana Udvardy | sudvardy@ucsusa.org
Killer Heat in the United States Climate Change and Public Health: - - PowerPoint PPT Presentation
Killer Heat in the United States Climate Change and Public Health: Addressing the Growing Crisis West Virginia University College of Law, Center for Energy and Sustainable Development Shana Udvardy | sudvardy@ucsusa.org AP/John Locher 1
AP/John Locher
Killer Heat in the United States
Climate Change and Public Health: Addressing the Growing Crisis West Virginia University College of Law, Center for Energy and Sustainable Development Shana Udvardy | sudvardy@ucsusa.org
IPCC 2018 SR15 Fig FAQ 1.2
2.00 1.75 1.50 1.25 1.00 0.75 0.50 0.25 0.00 Global temperature change relative to 1850-1900 (°C) 1960 1980 2000 2020 2040 2060 2080 2100 Human-induced warming
IPCC SR15 2018 SPM
+2°C +1.5°C
INSECTS PLANTS VERTEBRATES
ultramarinfoto / Getty Images
NOAA
Chasing Coral
IPCC 2018 SR15 Fig FAQ 1.2
Current warming rate 2.00 1.75 1.50 1.25 1.00 0.75 0.50 0.25 0.00 Global temperature change relative to 1850-1900 (°C) 1960 1980 2000 2020 2040 2060 2080 2100 Human-induced warming
IPCC 2018 SR15 Fig FAQ 1.2
Current warming rate
2.00 1.75 1.50 1.25 1.00 0.75 0.50 0.25 0.00
Global temperature change relative to 1850-1900 (°C)
1960 1980 2000 2020 2040 2060 2080 2100
Human-induced warming
to calculate heat in index
scenarios
the lower 48
0.5 1 1.5 2 2.5 3 3.5 4 4.5 5
1960s 1970s 1980s 1990s 2000s
Average days per year
Heat Wave Frequency
Habeeb et al., 2015
0.5 1 1.5 2 2.5
1960s 1970s 1980s 1990s 2000s
Average days per year
Heat Wave Intensity
Habeeb et al., 2015
10 20 30 40 50 60
1960s 1970s 1980s 1990s 2000s
Average days per year
Length of Heat Season
Habeeb et al., 2015
“We have seen a huge spike in ER visits and admissions…in the past several
We have been admitting people left and right.”
July 19, , 2019 AP/Richmond Times-Dispatch/P. Kevin Morley
For Example: 90⁰F and a relative humidity of 60%, the heat index is 100 ⁰F.
Midcentury (2036-2065): Steep increase in extreme heat
Mid idcentury: Days per year with HI I >105°F for African Americans
8x as many days per year
the Sonoran Desert region for a couple days per year
would experience these conditions at least 1x per year.
the Sonoran Desert region for a couple days per year
would experience these conditions at least 1x per year.
experience 7+ days of off- the-charts heat in an average year compared with <2,000 people today.
would lead to a staggering expansion of dangerous heat.
contain that expansion.
Mitigation:
Reaching net zero emissions by 2050
Adaptation:
Keeping People Safe
Credit: AP Photo David Goldman
AP Photo: Charlie Riedel AP: Rich Pedroncelli
National Occupational Safety Standards for Heat
Heat Illness and Fatality Prevention Act of 2019
Power sector [28%] and transportation [29%] industrial [22%], C&R buildings [12%], agriculture [9%]: Fed, state, local, individual
18% in 2018 to at least 50% in 2035
natural gas by 38%
46% in 2035
consumers energy bills between 2020 and 2035
http://www.ucsusa.org/killer-heat
Interactive data widget
http://www.ucsusa.org/killer-heat
Interactive maps
Congressional district map
Congressional district fact sheets (433): What you can do
1) Reach out on social media. 2) Follow your representatives’
Facebook pages or Twitter accounts. 3) Attend a members’ forum or event. 4) Write a letter to the editor for your local paper.
Thank You! We can do this!