
SLIDE 1
Keller Group plc Half year results 2017
31 July 2017
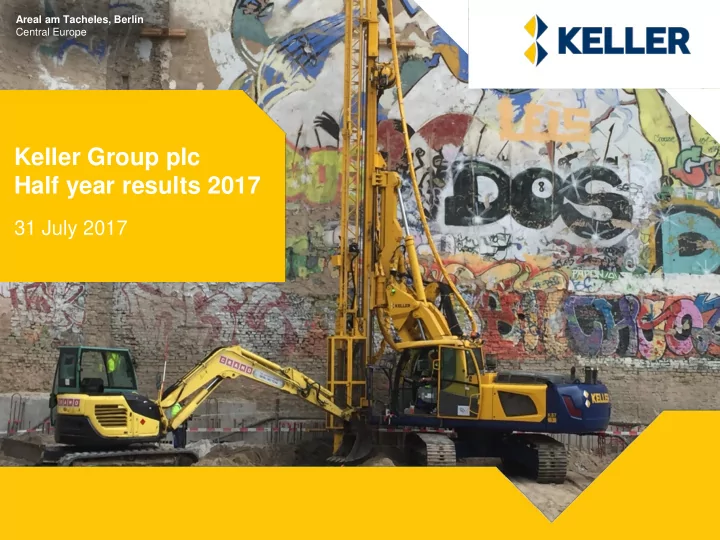
Areal am Tacheles, Berlin Central Europe
Keller Group plc Half year results 2017 31 July 2017 Road traffic - - PowerPoint PPT Presentation
Areal am Tacheles, Berlin Central Europe Keller Group plc Half year results 2017 31 July 2017 Road traffic accident South Africa 4 July 2017 Truck collided with two buses carrying Franki Africa employees to the Nkomati Mine project
Areal am Tacheles, Berlin Central Europe
2
3
4
5
St Kanzian South East Europe
7
£m H1 2017 H1 2016 % Change Revenue 991.1 849.7 +17% EBITDA 78.1 66.5 +17% Operating profit 44.0 35.6 +24% Net finance cost (4.7) (5.4) +13% Profit before tax 39.3 30.2 +30% Tax (13.4) (10.2)
Profit after tax 25.9 20.0 +30% EBITDA % 7.9% 7.8% +10 bps Operating profit % 4.4% 4.2% +20 bps Record revenue 4% up on a constant currency basis Effective tax rate 34% (FY2016: 35%) Strong performance from EMEA APAC loss reduced NA impacted by regional slowdowns
* Before non-underlying items
8
£m H1 2017 H1 2016 % Change Profit after tax* 25.9 20.0 +30% Non-underlying items Amortisation of acquired intangibles (4.5) (5.0) Exceptional Avonmouth credit 21.0 1.1 Other (0.6) (1.3) 15.9 (5.2) Tax on non-underlying items (0.1) 1.2 Non-controlling interests (0.7) (0.3) Attributable to shareholders 41.0 15.7 +161% Earnings per share* 35.0p 27.4p +28% Dividend per share 9.7p 9.25p +5% Non-underlying profits mainly relate to Avonmouth
* Before non-underlying items
Dividend up 5% 3.6x covered by underlying earnings
9
£m H1 2017 H1 2016 Revenue OP Margin Revenue OP Margin North America 474.5 28.6 6.0% 464.8 33.6 7.2% EMEA 346.4 20.0 5.8% 261.7 13.6 5.2% APAC 170.2 (3.8)
123.2 (9.6)
991.1 44.8 4.5% 849.7 37.6 4.4% Central costs
991.1 44.0 4.4% 849.7 35.6 4.2% Constant currency revenues up 4%: North America -10% EMEA +20% APAC +21%
* Before non-underlying items
Healthy contract margins in North America Good revenue and profit growth at EMEA Helped by Caspian project APAC loss more than halved Markets remain challenging
10 10
South Harford CSO Tunnel and Shaft, US Case Foundation
11 11
Hotel Annapurna, Les Gets Keller France
12 12
12
Cattle Creek Keller Australia
13 13
£m H1 2017 H1 2016 Goodwill/intangibles 178.5 181.5 Property, plant & equipment 398.7 383.7 Other non-current assets 29.8 32.0 607.0 597.2 Inventories 69.5 56.3 Receivables 598.9 534.6 Payables (436.8) (423.9) Working capital 231.6 167.0 Capital employed 838.6 764.2 Non-current assets held for sale
Other liabilities/provisions (52.1) (57.8) Retirement benefits (29.7) (30.5) Tax (13.4) (7.4) Net debt (297.3) (339.7) Net assets 446.1 376.8 Net capital expenditure of £31.5m Receivables increase reflects growth and currency Net debt 1.7x EBITDA
1.9x on a covenant basis 13
14 14
£m Original 2014 provision 54.0 2016 and 2017 credits: Property value (14.0) Insurance proceeds (17.6) Other (3.7) Net cost 18.7
15 15
£m H1 2017 H1 2016 Cash from operations before non-underlying items (3.7) 41.9 Cash inflows from non-underlying items 8.3 (2.1) Cash from operations 4.6 39.8 Capex – net (31.5) (30.8) Interest (5.9) (5.1) Tax (8.7) (11.0) Acquisitions (3.0) (74.2) Disposals 62.0
(13.8) (13.7) Net cash flow 3.7 (95.0) Opening net debt (305.6) (183.0) Opening 2006 swap liability
Exchange movements 4.6 (37.1) Closing net debt (297.3) (339.7) Full year capex expected to be circa £75m 2017 acquisitions: GEO-instruments for cash consideration of £2.5m ($3.1m) £62m disposal is Avonmouth
17 17
18 18
19 19
Order book (£m constant currency) Order book split
400 500 600 700 800 900 1000 1100 1200 2013 2014 2015 2016 2017
20 20
21 21
22 22
23 23
24 24
25 25
This document contains certain ‘forward looking statements’ with respect to Keller’s financial condition, results of operations and business and certain of Keller’s plans and objectives with respect to these items. Forward looking statements are sometimes, but not always, identified by their use of a date in the future or such words as ‘anticipates’, ‘aims’, ‘due’, ‘could’, ‘may’, ‘should’, ‘expects’, ‘believes’, ‘intends’, ‘plans’, ‘potential’, ‘reasonably possible’, ‘targets’, ‘goal’ or ‘estimates’. By their very nature forward-looking statements are inherently unpredictable, speculative and involve risk and uncertainty because they relate to events and depend on circumstances that will occur in the future. There are a number of factors that could cause actual results and developments to differ materially from those expressed or implied by these forward-looking statements. These factors include, but are not limited to, changes in the economies and markets in which the Group
which the Group operates; the impact of legal or other proceedings against or which affect the Group; and changes in interest and exchange rates. All written or verbal forward looking statements, made in this document or made subsequently, which are attributable to Keller or any other member of the Group or persons acting on their behalf are expressly qualified in their entirety by the factors referred to above. Keller does not intend to update these forward looking statements. Nothing in this document should be regarded as a profits forecast. This document is not an offer to sell, exchange or transfer any securities of Keller Group plc or any of its subsidiaries and is not soliciting an offer to purchase, exchange or transfer such securities in any jurisdiction. Securities may not be offered, sold or transferred in the United States absent registration or an applicable exemption from the registration requirements of the US Securities Act of 1933 (as amended).
27 27
28 28
29 29
30 30
Approximate market share (Where we operate today)
31 31
Revenue – by product 2016 Revenue – by market 2016
32 32
2016 Revenue by country
Total revenue £1,780m 49% 9% 5% 12%
33 33
34 34
35 35
36 36
Common management approach Group
North America
Europe, Middle East, Africa and Latin America Asia Pacific Branches Branches Branches Business units Business units Business units
Three Divisions 21 Business units 180 Branches Performance management Approvals and delegated authorities Functional and GPT best practices Specific initiatives High performance leadership and culture Strategic framework
37 37
Top tier Middle tier Bottom tier
38 38
Accelerated Frequency Rate (AFR)
0.2 0.4 0.6 0.8 1 1.2 1.4 2012 2013 2014 2015 2016 1.2 0.61 0.39 0.35 0.34 Accidents per 100,000 hours 0.27 June 2017
Road traffic accident in South Africa on 4 July 2017 not included
39 39
40 40
US Housing Starts (000s)
Source: US Census Bureau Housing Starts
US Construction spend as % GDP
Source: IHS global insight and World Bank 5 5.5 6 6.5 7 7.5 8 8.5 9
41 41
California Department of Water Resources via Reuters
42 42
Leverage typically to be maintained at between 1.0x and 2.0x EBITDA Any short term return of capital likely to be share buy-back