katharine w kenny
play

Katharine W. Kenny Vice President, Investor Relations European - PowerPoint PPT Presentation

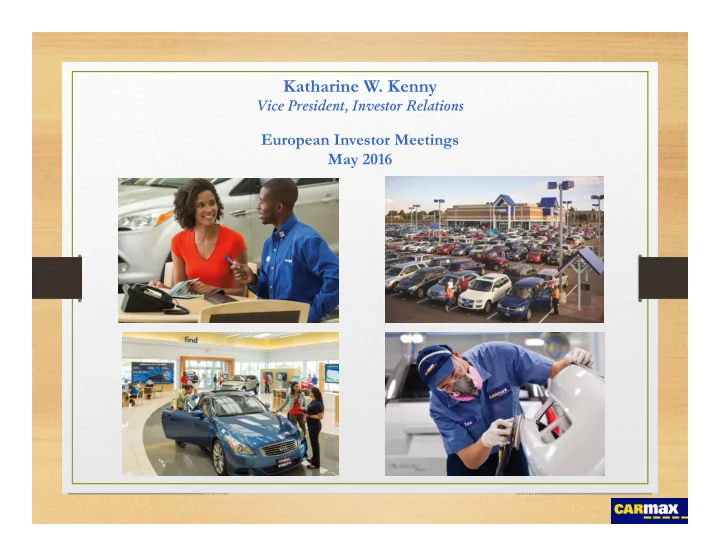
Katharine W. Kenny Vice President, Investor Relations European Investor Meetings May 2016 Forward-Looking Statements This presentation contains forward looking statements, which are subject to risks and uncertainties. Additional discussion


  1. Katharine W. Kenny Vice President, Investor Relations European Investor Meetings May 2016

  2. Forward-Looking Statements This presentation contains forward ‐ looking statements, which are subject to risks and uncertainties. Additional discussion of factors that could cause actual results to differ materially from management’s projections and estimates is contained in the CarMax, Inc. SEC filings, including its Form 10 ‐ K, for the year ended February 29, 2016. The company disclaims any intent or obligation to update its forward ‐ looking statements. 2

  3. Competitive Advantages  Unique consumer offer  Competitively low, no ‐ haggle prices  Huge selection  Guaranteed quality  Transparent, low pressure sales process 3

  4. Competitive Advantages  Well ‐ tested proprietary processes/systems  Proven adaptable to changing market conditions  Well ‐ trained, engaged associates  Award ‐ winning culture  Fortune’s “100 Best Companies to Work For” (12 yrs)  Training Magazine’s Top 125 (9 yrs) 4

  5. Current CarMax Locations 159 used car stores in 79 markets 5

  6. Compelling Growth Opportunity  Stores currently reach only 65% of population  Market share (age 0 ‐ 10 used vehicles):  Average  5% in existing markets  Less than 3% nationwide  First or second purchase cycle in many markets  Expansion and share gains will drive future growth 6

  7. Compelling Growth Opportunity 7

  8. Compelling Growth Opportunity Large Markets: Small Format: FY13: Denver ‐‐ FY14: St. Louis Harrisonburg, Va. Philadelphia Jackson, Tn. FY15: Cleveland Dothan, Al. Lynchburg, Va. Tupelo, Ms. FY16: Minneapolis Gainesville, Fla. Boston Tallahassee, Fla. Bloomington, Ill. St. Louis, Mo. (fill ‐ in) FY17: San Francisco Springfield, Ill. Bristol, Tn. 8

  9. Financial Summary Total Revenues Earnings per Diluted Share $16 B $3.50 $3.03 $2.73 $14 B $3.00 $12 B $2.16 $2.50 $1.87 $10 B $1.79 $1.65 $2.00 $8 B $1.24 $1.50 $6 B $0.89 $0.80 $1.00 $0.61 $4 B $0.25 $0.50 $2 B $0 B $0.00 FY06 FY07 FY08 FY09 FY10 FY11 FY12 FY13 FY14 FY15 FY16 FY06 FY07 FY08 FY09 FY10 FY11 FY12 FY13 FY14 FY15 FY16 10 year CAGR = 9.2% 10 year CAGR = 17.4% 9

  10. CarMax Business Model  Diversified gross profit base*:  Used  Wholesale  EPP  Finance *Percentages represent breakdown of gross profit dollars, including CAF income, excluding Other gross profit 10

  11. Retail Used Vehicles Used Gross Profit $ Per Unit $2,300 $2,250 $2,200 $2,150 $2,100 $2,050 $2,000 FY12 FY13 FY14 FY15 FY16 CarMax is the largest retailer of used cars in the U.S., selling > 2x as many cars as the next largest retailer 11

  12. Wholesale Vehicles Total Wholesale Units Wholesale Gross Profit $ Per Unit 450 K $1,500 394 K 400 K 376 K $1,250 343 K 350 K 325 K 317 K $1,000 300 K $750 250 K 200 K $500 FY12 FY13 FY14 FY15 FY16 FY12 FY13 FY14 FY15 FY16 CarMax has 67 auction locations and operates the third largest auction operation in the U.S. 12

  13. CarMax Auto Finance CAF Avg Managed Receivables CAF Income $392.0 $10 B $9.1 $400 M $367.3 $7.9 $8 B $6.6 $336.2 $350 M $5.4 $6 B $4.7 $299.3 $300 M $4 B FY12 FY13 FY14 FY15 FY16 $262.2 $250 M CAF Net Interest Margin (1) 8% $200 M 7% 7.4% 7.3% 6.9% 6% $150 M 6.5% 6.1% 5% $100 M 4% FY12 FY13 FY14 FY15 FY16 FY12 FY13 FY14 FY15 FY16 CAF is 8 th largest originator of used cars loans in the U.S. 13 (1) Before provision for loan losses

  14. Stock Repurchase Program Stock Repurchase Activity Shares Repurchased Weighted Avg Diluted Shares 240 M 25 M Weighted avg shares outstanding 230 M 20 M Shares repurchased 17.5 16.3 220 M 15 M 210 M 10 M 200 M 6.9 5.8 5 M 190 M 180 M 0 M FY12 FY13 FY14 FY15 FY16 Cumulative total of 46.4 million shares, or 20% of outstanding share base, have been repurchased 14

  15. Capital Structure Debt ‐ to ‐ Capital Ratio (1) (excluding non ‐ recourse debt) 60% 50% 46.8% 46.3% 43.5% 40.6% 40.5% 40.0% 40% 34.1% 31.1% 30% 24.3% 24.0% 20.9% 18.7% 20% 17.1% 10% 0% FY04 FY05 FY06 FY07 FY08 FY09 FY10 FY11 FY12 FY13 FY14 FY15 FY16 Targeted ratio is in the range of 35% to 45% (1) Debt includes finance and capital lease obligations and 8 times rent expense. 15

  16. Online Enhancements  April rollout of website redesign  Adaptive to all screen sizes  More personalized experience  Improved, high resolution pictures  Ability to schedule an appt, transfer/hold vehicles  Monthly payment estimates/calculator  Easier to build and display new features  CarMax Owner App  One place to store vehicle documents  Exclusive discounts 16

  17. New Site Old Site 17

  18. 18

  19. 19

  20. Continuous Improvement  Customer Experience  Ongoing testing  Home delivery  Online finance  Enhancing execution/reducing waste  Mobile appraisal tool for buyers  More efficient transportation system 20

  21. 21

Download Presentation
Download Policy: The content available on the website is offered to you 'AS IS' for your personal information and use only. It cannot be commercialized, licensed, or distributed on other websites without prior consent from the author. To download a presentation, simply click this link. If you encounter any difficulties during the download process, it's possible that the publisher has removed the file from their server.

Recommend


More recommend