
SLIDE 1
July 2017
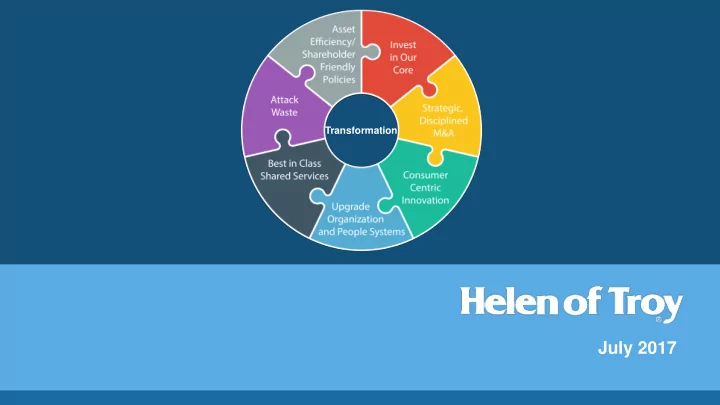
Transformation
July 2017 Forward Looking Statements and Non-GAAP Information - - PowerPoint PPT Presentation
Transformation July 2017 Forward Looking Statements and Non-GAAP Information Forward Looking Statements: Certain written and oral statements made by our Company and subsidiaries of our Company may the duration and severity of the cold and flu
July 2017
Transformation
and Non-GAAP Information
2
Forward Looking Statements:
Certain written and oral statements made by our Company and subsidiaries of our Company may constitute "forward-looking statements" as defined under the Private Securities Litigation Reform Act
"believes", "expects", "plans", "may", "will", "should", "seeks", "estimates", "project", "predict", "potential", "continue", "intends", and other similar words identify forward-looking statements. All statements that address operating results, events or developments that we expect or anticipate will
expressing general expectations about future operating results, are forward-looking statements and are based upon our current expectations and various assumptions. We believe there is a reasonable basis for our expectations and assumptions, but there can be no assurance that we will realize our expectations or that our assumptions will prove correct. Forward-looking statements are subject to risks that could cause them to differ materially from actual results. Accordingly, we caution readers not to place undue reliance on forward-looking statements. The forward-looking statements contained in this presentation should be read in conjunction with, and are subject to and qualified by, the risks described in the Company's Form 10-K for the year ended February 28, 2017 and in our other filings with the SEC. Investors are urged to refer to the risk factors referred to above for a description of these risks. Such risks include, among others, our ability to deliver products to our customers in a timely manner and according to their fulfillment standards, the costs of complying with the business demands and requirements of large sophisticated customers, our relationships with key customers and licensors, our dependence on the strength of retail economies and vulnerabilities to any prolonged economic downturn, our dependence on sales to several large customers and the risks associated with any loss or substantial decline in sales to top customers, expectations regarding our recent and future acquisitions or divestitures, including our ability to realize anticipated cost savings, synergies and other benefits along with our ability to effectively integrate acquired businesses or separate divested businesses, circumstances which may contribute to future impairment of goodwill, intangible or other long-lived assets, the retention and recruitment of key personnel, foreign currency exchange rate fluctuations, disruptions in U.S., U.K., Euro zone, and other international credit markets, risks associated with weather conditions, the duration and severity of the cold and flu season and other related factors, our dependence on foreign sources of supply and foreign manufacturing, and associated operational risks including, but not limited to, long lead times, consistent local labor availability and capacity, and timely availability of sufficient shipping carrier capacity, risks to the Nutritional Supplements segment associated with the availability, purity and integrity of materials used in the manufacture of vitamins, minerals and supplements, the impact of changing costs of raw materials, labor and energy on cost of goods sold and certain operating expenses, the geographic concentration and peak season capacity of certain U.S. distribution facilities increases our exposure to significant shipping disruptions and added shipping and storage costs, our projections of product demand, sales and net income are highly subjective in nature and future sales and net income could vary in a material amount from such projections, the risks associated with the use of trademarks licensed from and to third parties, our ability to develop and introduce a continuing stream of new products to meet changing consumer preferences, increased product liability and reputational risks associated with the formulation and distribution of vitamins, minerals and supplements, the risks associated with potential adverse publicity and negative public perception regarding the use of vitamins, minerals and supplements, trade barriers, exchange controls, expropriations, and other risks associated with U.S. and foreign operations, the risks to our liquidity as a result of changes to capital market conditions and other constraints or events that impose constraints on our cash resources and ability to
information systems, the risks associated with information security breaches, the increased complexity of compliance with new government regulations covering vitamins, minerals and supplements, the risks associated with product recalls, product liability, other claims, and related litigation against us, the risks associated with accounting for tax positions, tax audits and related disputes with taxing authorities, the risks of potential changes in laws in the U.S. or abroad, including tax laws, regulations or treaties, employment and health insurance laws and regulations, and laws relating to environmental policy, financial regulation, transportation policy and infrastructure policy along with the costs and complexities of compliance with such laws, and our ability to continue to avoid classification as a controlled foreign
result of new information, future events or otherwise.
Highly Favorable Business Fundamentals Powerful Global Brands Exciting Growth Drivers Highly Attractive Business Economics
Health & Home 41.2%
Net Sales* Beauty 23.1%
Net Sales* Housewares 27.2%
Net Sales* Nutritional Supplements 8.5%
Net Sales*
3
* Based upon FY 17 Consolidated Net Sales Revenue
Net Sales ($ in Millions) Adjusted EBITDA ($ in Millions) Adjusted Diluted EPS 4
Throughout this presentation we refer to certain GAAP and non-GAAP measures used by management to evaluate financial performance. Please see explanation of certain terms and measures and reconciliations
* Source: Helen of Troy
FY 15 FY 14 FY 13 FY 16 FY 17
$1,288 $1,317 $1,445 $1,546 $1,537 $190 $195 $220 $232 $238 $4.47 $4.50 $5.85 $6.25 $6.73
FY 15 FY 14 FY 13 FY 16 FY 17 FY 15 FY 14 FY 13 FY 16 FY 17
points
FY16
buy-back
FY17 Highlights
Three Year Performance Since New Strategic Plan in FY15
5
Transformation
Today FY 2014
Transforming from Holding Company to Operating Company
Global Shared Services Platform Strategic Plan Culture
Improved Performance
Housewares Beauty Nutritional Supplements Health & Home
Housewares Healthcare & Home Environment Corporate & Support Services Beauty
6
Strategic Plan Culture
More Efficient and Collaborative Operating Structure Transformational Strategy World Class Brands
7 Global Shared Services Platform Strategic Plan Culture
Improved Performance
Housewares Beauty Nutritional Supplements Health & Home
2003 2004 2007 2008 2009 2010 2010 2011 2014 2015
Health & Home
FY17 Net Sales: $632.7 MM
Beauty
FY17 Net Sales: $355.8 MM
Nutritional Supplements
FY17 Net Sales: $130.5 MM
8
2016
Housewares
FY17 Net Sales: $418.1 MM
9
Favor brands with #1 or #2 market position Accretive to cash flow and Adjusted Diluted EPS Enhances revenue growth and sweetens the mix HELE likely to add value and
HELE can accelerate growth
Bias toward high margin, proprietary consumables Global potential
differentiated subcategory.
capital.
scalability across our shared services to leverage and enhance efficiencies across sourcing, purchasing, distribution, warehousing, logistics, marketing, R&D and other fixed costs.
requiring additional resources, expertise and/or capital to accelerate
for growth in core HELE channels, geographies or adjacent categories.
revenue stream.
appeal or relevance.
portability.
Select M&A Criteria
Other considerations
1 2 3 4 5 6 7
World Class Licensors
largest, and most global trademark licensees
global licensee
global licensee
portfolio
majority of licenses
World Class Brands World Class Partnerships
10
> 60% of HOT Net Sales FY 17 up DD% vs. YAG Higher Profit Contributors Criteria
Higher Margin Asset Efficient Differentiated Market Leader
1 2 3 4
Growth Adjacencies
Business Unit Leadership Brand Category Rank
Health & Home
Consumer Ear Thermometers #1 Professional Ear Thermometers #1 Faucet Mount Purifiers #1 Pitcher Purifiers #2 Pharmacy Humidifiers #1 Air Purifiers #1
Housewares
Premium Kitchen & Home Gadgets #1 Outdoor Thermal Hydration #1
Beauty
Stylist Preferred U.S. Professional Curling Iron #1
11
12
Global Business Segments Global Shared Services
Global Leadership Council (GLC)
Global Leadership Council (GLC)
13
Larry Witt
President Housewares
Open
President Beauty
Ben Tiecher
President Nutritional Supplements
Lisa Kidd
Chief People Officer
Jon Kosheff
President Health & Home
Vince Carson
Chief Legal Officer and External Relations
John Conklin
Chief Information Officer
Jack Jancin
Corporate Business Development
Brian Grass
Chief Financial Officer
Jay Caron
Chief Supply Chain Officer
CEO
Julien Mininberg
Strong Operating Cash Flow Efficient Tax Structure Strong Balance Sheet
Growth Productivity
14
Delivering
structure
for the remainder of the fiscal year
15
Throughout this presentation we refer to certain GAAP and non-GAAP measures used by management to evaluate financial performance. Please see explanation of certain terms and measures and reconciliations of Non-GAAP financial measures in the Appendix section.
Adjusted Operating Income ($ in Millions)
4 YR. CAGR = 5.8%
Adjusted Operating Margin 13.7% 13.9% 14.2% 14.0% 14.4%
FY 15 FY 14 FY 13 FY 16 FY 17
$177 $183 $206 $217 $222
Cash Flow from Operations ($ in Millions)
4 YR. CAGR = 27%
Cash Flow Productivity 63% 133% 131% 163% 148% $88 $154 $179 $187 $229
FY 15 FY 14 FY 13 FY 16 FY 17
Adjusted Income ($ in Millions)
4 YR. CAGR = 7.1%
Return on Capital Adjusted Return on Capital 11.2% 13.8% 7.4% 12.6% 11.1% 14.3% 7.0% 12.4% 9.2% 12.3% $143 $146 $170 $180 $188
FY 15 FY 14 FY 13 FY 16 FY 17
16
Key Drivers
2012 2013 2014 2015 2016 2017 Helen of Troy Limited 100.00 114.09 200.95 235.75 293.42 300.62 Peer Group Index 100.00 122.80 139.58 151.07 154.49 166.23 Nasdaq Market Index 100.00 106.52 145.21 167.30 153.69 196.33 Fiscal Year ended the last day of February
Capital Priorities
Shareholders
Access to Capital
1. Conservative Approach to Debt 2. Strong Cash Flow Generation 3. Access to Favorable Terms 4. Capacity to Change Capital Structure
Capital Expenditures $16 - $20 million expected for FY 18
17
18
Throughout this presentation we refer to certain GAAP and non-GAAP measures used by management to evaluate financial performance. Please see explanation of certain terms and measures and reconciliations of Non-GAAP financial measures in the Appendix section.
Housewares (a) Health & Home Nutritional Supplements Beauty Total First quarter fiscal 2017 sales revenue, net $ 84,603 $ 146,355 $ 35,940 $ 81,040 $ 347,938 Core business 8,165 5,017 (4,321) (1,117) 7,744 Impact of foreign currency (488) (1,106)
(2,225) Venezuela re-measurement
6,148
Change in sales revenue, net 13,825 3,911 (4,321) (1,748) 11,667 First quarter fiscal 2018 sales revenue, net $ 98,428 $ 150,266 $ 31,619 $ 79,292 $ 359,605 Total net sales revenue growth 16.3 % 2.7 % (12.0) % (2.2) % 3.4 % Core business 9.7 % 3.4 % (12.0) % (1.4) % 2.2 % Impact of foreign currency (0.6) % (0.8) % 0.0 % (0.8) % (0.6) % Acquisitions 7.3 % 0.0 % 0.0 % 0.0 % 1.8 % Operating margin (GAAP) First quarter fiscal 2018 18.4 % 9.7 % (109.4) % (1.6) % (0.9) % First quarter fiscal 2017 18.3 % 6.6 % (14.7) % 3.8 % 6.6 % Adjusted operating margin (non-GAAP) First quarter fiscal 2018 20.1 % 12.3 % (1.8) % 6.3 % 11.9 % First quarter fiscal 2017 20.3 % 11.3 % 6.5 % 10.5 % 12.8 % (a) Includes approx. one-half month of incremental operating results from Hydro Flask, which was acquired on March 18, 2016. Three Months Ended May 31, 2017
19
Accelerate non core growth through acquisition Further improve capability and efficiency through Shared Services excellence Place greater investment behind HELE seven leadership brands
Continue to expand operating cash flow
Permission to Win
class market positions and proven growth strategies
innovation pipeline
Growth
Expansion
20
Health & Home
healthcare and consumables
margins
product lines
shared services
Housewares
shared services
margins
Hydro Flask acquisition
expansion and to maintain growth
Beauty
right to win
research
drive margin and revenues
margins
Nutritional Supplements
technology capabilities
category/megatrends
digital marketing and content development
proven claims
acquisition investments
Operating Margin Drivers Strategies
21
Source: Helen of Troy
* Percentage of consolidated net sales
Grow eCommerce Enhanced Digital Marketing
FY 2014 FY 2015 FY 2016 FY 2017
13.2%* 6.4%*
+30% YOY
More Connected Devices
FY 18 Outlook by Business Segment
Headwinds/Tailwinds Tailwinds
category introductions
investment in greatest
from Hydro Flask Headwinds
brick and mortar retail
rationalization
Assumptions
growth of 1.5% to 4.1%
hold for remainder of year; $0.07/share impact
for portion of exposure
YOY; approx. $0.90/share
impairments or acquisitions assumed FY 18 Outlook
revenue guidance range to $1.56 to $1.60 billion
GAAP diluted EPS guidance to a range of $4.54 to $4.87
2018 non-GAAP adjusted diluted EPS to a range of $6.50 to $6.90
10% and 12% for the remainder of the fiscal year
Health & Home 41.2%
MSD
Beauty 23.1%
Housewares 27.2%
11%-13%
Nutritional Supplements 8.5%
Flat Total
100.0%
1.5%-4.1% Business Segments
Source: Helen of Troy
22
* Excludes share buybacks, acquisitions and material currency fluctuations
23
Throughout this presentation we refer to certain GAAP and non-GAAP measures used by management to evaluate financial performance. Please see explanation of certain terms and measures and reconciliations of Non-GAAP financial measures in the Appendix section.
Powerful global brands; many market leaders Accelerating innovation and market share Outstanding cash flow and financial flexibility Proven ability to acquire and integrate New shared services infrastructure Upgraded & elevated management talent Transformational new strategy & culture
24
25
26
Source: Helen of Troy
27
Healthcare Home Environment
Source: Helen of Troy
Braun Blood Pressure Braun Thermometers Vicks Humidification-Pharmacy Vicks Thermometers Vicks Vapopads Vicks Vaposteam SoftHeat Hot/Cold Therapy Healthcare Other Honeywell Air Purifiers Honeywell Dehumidifiers Honeywell Fans Honeywell Heaters Honeywell Humidification-Seasonal PUR Water Filtration Stinger Insect Control Home Environment Other
FY17: $632.7 Million Net Sales
Leadership Brand
28
Braun Thermometers Won Three Prestigious 2017 iF Design Awards
29
Braun PRT2000 Braun IRT 6520
Leadership Brand
Braun NTF3000
30 Vicks 13.9% Braun 22.2% Private Label 42.7% Exergen 7.3% Safety 1st 2.6% Mobi 2.6% Other 8.7%
US Thermometer $ Share
Source: 3rd party syndicated retail data, L52wks ending 3/4/17
Leadership Brand
36.1% Market Share
31
Source: 3rd party syndicated drug trade class data L-52 weeks ending 3/4/17
Vicks 59.4% HoT PL 11.4% Protec & Kaz 4.0% Private Label 8.0% Crane 7.5% MyPurMist 4.2% Safety1st 2.9% Other 2.5%
74.8% Market Share
US Humidifier $ Share “Pharmacy”
Leadership Brand
32
Leadership Brand
Deep Consumer Understanding Product Innovation Excellent Retail and Consumer Execution
Source: 3rd party syndicated data, NPD Traqline and internal Health & Home estimates for devices only CY 2016
= =
33
Leadership Brand
.
Febreze, 3.0
Holmes 13% Germ Guardian, 6.8 Therapure 6% Idylis 5% Dyson 5% Winix 2% Iconic Pro 2% Alen 1% Kenmore 1% Homedics 1% Hunter 1% Blueair, 0.4 Sharp 0% Bionaire 0% Other 0% ,
52.3%
15% 19% 26% 30% 38% 39% 40% 42% 49% 53% 55% 55%
34 PUR faucet mount filters are certified to remove more contaminants than any other filter using our MAXion™ filtration system and are the only ones certified to reduce over 70 contaminants including lead, pesticides, mercury, and more providing cleaner, healthier water.
Leadership Brand
35
Source: 3rd party syndicated data , L-52 weeks ending 2/25/17 (Does not include DIY, Online, Costco or BB&B)
Leadership Brand
36
Retail Appliances Brush, Comb & Accessories Professional
Retail Appliances Professional Appliances Brushes, Combs & Accessories
FY17: $355.7 Million Net Sales
Personal Care
38
Leadership Brand
39
Reducing the time and effort needed to achieve perfect curls, volume and movement Designed and developed with professionals, for professionals.
COMFORTABLE TO USE EASY TO MASTER GUARANTEED RESULTS
HTCURL1181 - 1” HTCURL1110 - 1¼”
Leadership Brand
40
Leadership Brand
41
70% MORE* coverage, for fast drying and styling, with less damage. 60% Faster Ships Summer of 2017
Salon 360 Surround AC Dryer
PATENT PENDING DUAL AIRFLOW SYSTEM EXCLUSIVE 360 MODE 60% FASTER, LESS DAMAGE Delivering 70% MORE* coverage, targeted, downward air jets, surround each hair section for a fast, smooth, but controlled, gentle blow
SALON, SHINY LOOKING RESULTS Downward air flow, saturated with anti-frizz ions, naturally smooths cuticle for sleek, shiny looking, frizz-free, salon-like results
42 ADVANCED DESIGN -
EASY TO USE
10 variable Digital LED settings, low friction, snag free plates, slim housing, and plate lock feature.
ADVANCED COATINGS –
LESS DAMAGE FOR HEALTHY- LOOKING STYLES
Premium Tourmaline 3x
smoother surface and glide. 2X less frizz*, 24-Hour Frizz Control*. Long- Lasting results.
ADVANCED HEAT –
FASTER WORKING
455oF 15 second heat up with 33% more styling surface^ for faster results and 4.5X straighter*, smooth results.
ADVANCED COATINGS –
LESS DAMAGE FOR HEALTHY-LOOKING STYLES
3X Premium Ceramic-Coated Technology, for even heat, less
Ionic generator for maximum frizz protection and shine
ADVANCED DESIGN –
EASY TO USE
Multidimensional, snag-free combination 3x ceramic and detangling straightening bristles for frizz-free, even results. Designed to get close to the
with 10 Digital LCD settings and Smart Heat Memory. Dual voltage. 20% lighter* design with soft touch housing for optimal comfort.
ADVANCED HEAT –
FASTER WORKING
XL 30% longer^ for fast results with 4X MORE^ ceramic straightening coverage
Pro collection salon one-step STRAIGHT and SHINETM Perfect Straight TM Smooth Brilliance Flat Iron
Ships Summer of 2017
43
Leadership Brand
Based Upon Universal Design: To provide products and environments that are easily usable and comfortable for the largest spectrum of people possible.
* Proforma FY 2005 Sales – HOT acquired June 2004
44
Source: Helen of Troy
Leadership Brand
2005 2006 2007 2008 2009 2010 2011 2012 2013 2014 2015 2016 2017 $98 $128 $138 $164 $175 $199 $217 $237 $259 $274 $296 $310 $418
OXO Hydro Flask
Categories
45
Leadership Brand Chef’s Mandolin Slicer 2.0 Pour-Over Kettle with Thermometer Thermocouple Thermometer Little Salad & Herb Spinner 4.0 Microwave Egg Cooker Glass Mixing Bowls Microwave Omelet Maker Microwave Bacon Crisper 3 Blade Hand-Held Spiralizer Glass Pour-Over Coffee Maker
46
Features
shock
uniformly
Containers
Leadership Brand
Cubby Features:
ground
coverage
Cubby Plus Features: Cubby features plus:
47
Leadership Brand
48
Leadership Brand
49
2 Cold Up to 24 Hrs. Hot Up to 6 Hrs. Due to the fact that the flasks are vacuum insulated, hot beverages stay hot up to 6 hours and cold beverages stay cold up to 24 hours 3 18/8 Stainless Steel All flasks are made of 18/8 stainless steel, BPA free and highly resistant to absorbing odor, taste and bacteria. They are simple to clean, don't have a liner to scratch and are completely recyclable 4 5 Sweat Free The double wall vacuum insulation prevents condensation with cold
beverages, the vacuum insulation also prevents heat from transferring outside of the Hydro Flask, keeping the outside surface temperature comfortable to hold Vacuum Insulation Hydro Flasks are vacuum insulated, which means there is an absence of matter between the two stainless steel walls. Since there is no matter, the temperature outside
inside the flask TempShield ™ Used in 100% of Hydro Flask products, our unique double wall insulation protects temperature for up to 24 hours cold and 6 hours hot PRO-GRADE STAINLESS STEL
18/8
18/8 pro-grade stainless steel won't retain or transfer flavors, ensuring the pure taste of your beverage Proprietary powder coat for an easy-grip, sweat- free extra durable bottle you can take anywhere Powder Coating The Hydro Flask product offering includes a multitude of color choices, all of which include a proprietary powder coat for an easy-to-grip, sweat-free bottle you can take anywhere
Hydro Flask's leading technology and design is setting the standard for product performance within the category
Flex Cap 64 oz. Wide Mouth Growler Hydro Flask 64 oz Growler receives recognition for its Fresh Carry System™ cap.
Leadership Brand
50
2016 19.5% #2
2017 33.1% #1
2016 16.7% #4
2017 39.4% #1
Sport and Outdoor Market Latest YOY 52 weeks ending 3/18/17* Natural Products Industry Health-and-Wellness Insights (HWI) Latest 24 weeks ending 3/19/17**
* Source: 3rd party syndicated data , L-52 weeks ending 3/18/17 ** Source: 3rd party syndicated data , L-52 weeks ending 3/19/17
Hydration Coffee Beer Food Accessories Leadership Brand
Outdoor Natural Foods Micro Breweries Coffee Sporting Goods Golf & Yoga Online
US Wholesale Direct Sales International Outdoor Online Direct Military Natural Foods Sporting Goods Corporate / Misc Golf / Yoga Coffee Micro- Breweries
CHANNEL MIX GEOGRAPHIC MIX
And Where to Play: Premium Outdoor, Natural Foods and Specialty Beverage Channels in the US
51
Leadership Brand
52
NEW PRODUCT
Leadership Brand
53
Leadership Brand
54
Inspiring Wellness
55
56
A Leading, Direct-to-Consumer Marketer of Premium, Doctor Branded VMS Products
Source: Helen of Troy
Anti-Aging Support Blood Sugar Support Brain/Mental Health Gastrointestinal Health General Health Heart Health Cold/Flu-immune Joint Health Mood Support Sexual Health Sleep Supoort Sports/Energy/Weight Vision Supoort Other
FY17: $130.5 Million Net Sales
57
Highly Respected Doctors and Natural Health Experts Education-Driven Content and Marketing Model High Value Database of Loyal DTC Customers Innovative, Superior Quality Products Repeatable, High Margin Continuity Sales DTC Leader Successfully Transformed from Direct Mail to Digital
Healthy Directions is a leading DTC marketer of doctor and health nutrition expert endorsed nutritional supplements, topical skincare and other health and wellness products. The Company’s innovative, premium products are primarily sold via digital and direct mail channels. A 25+ year track record of quality and regulatory compliance underpins its superior customer loyalty
In FYE17, Healthy Directions transformed the Company’s e-commerce platform, customer relationship management and order management systems to compete in the rapidly growing online VMS sector while still leveraging historical leadership in VMS direct mail Healthy Directions’ innovative, highly efficacious supplements and topical products are based on gold-standard clinical research and made to industry-leading quality standards by third party manufacturers driving a low-cost
products from concept to market in 9 months with robust, supportable claims Healthy Directions has a rich library of original content across a wide range of health topics and is aggressively expanding its digital content marketing to engage new consumers in an increasingly online driven industry Healthy Directions’ family of highly respected doctors and wellness experts in the natural health field engender trust and provide consumers with validated knowledge and product confidence The Company has a multi-million customer database of customers. Healthy Directions’ average customer tenure
The Company’s highly popular AutoDelivery (“AD”) subscription program is substantial and growing highly profitable
58
HEALTH MEGATRENDS
SAFE SKIN CARE HEART HEALTH BLOOD SUGAR DIGESTIVE HEALTH PAIN SLEEP
$2.5 B market $569 M market $2.3 B market $1.5 B market $450 M market(2) $3.2 B market
Doctor/Physician Recommendations are the #1 Influencer of Supplement User Purchases – 90%(1)
HEALTHY DIRECTIONS KEY HEALTH MEGATRENDS STRATEGIC FOCUS
Since 2011 Since 2012 Since 1995 Since 1991 Since 1995 Since 2012
NATIONALLY REPUTED EXCLUSIVE AND LONG-TERM DOCTOR BRAND AMBASSADORS
Source: Nutrition Business Journal Direct-to-Consumer Report 2016 and Euromonitor. Note: Market sizes represent 2015 sales per NBJ. (1) Source: NMI SORD 2015 (Capsugel Presentation). (2) Represents topical analgesic market in the U.S.
59
DRTV E-NEWS VIDEOS/WEBINARS SOCIAL MEDIA WEBSITES E-BOOKS/REPORTS MAGALOGS INSERTS CATALOGS NEWSLETTERS
USE ENGAGE
W A N T
WANT RESEARCH BUY COMMENT
CRM New CRM Key benefits:
(purchase history, customer lifetime value, promotion history) during the live interaction on the telephone or via chat
improved upselling, cross-selling and overall customer service
Replaced 20+ year old order management system and customer relationship management system is expected to provide significant marketing flexibility and increase topline through cross selling and upselling. These platforms are in the immediate post-implementation phase and are expected to deliver benefits in FYE18
Involve
Integrate
scorecards Improve
service
workflow management
base
New Order Management Key benefits:
Warehouse Management System (WMS) that is integrated with Intelligrated’s RTS pick and put-to-light system
authorization, PayPal on AutoDelivery, improved credit card processing capabilities through current processing platform provider
INVENTORY MANAGEME NT CATALOG MANAGEMENT LOYALTY MANAGEMENT SEARCH SERVICES PERSONALIZED SERVICES PAYMENT SERVICES COMPAIGN MANAGEMENT USER MANAGEMENT REPORTING & DATA ANALYTICS CROSS-SELLING & UP DRLLING
New eCommerce Platform Key benefits:
manage their accounts, one-click ordering, significantly improved site speed, mobile optimization, consolidation of the current four web platforms, common cart, A/B testing, significantly accelerated marketing campaign implementation delivering lower costs on digital as compared to direct mail
60
61
Health & Home Marlborough, MA Beauty Personal Care Danbury, CT Housewares New York City Nutritional Supplements Bethesda, MD EMEA RMO Lausanne, Switzerland Asia/Pacific RMO Hong Kong China Shared Service Centers Shenzhen & Macao Latin America RMO Mexico City
Shared Service Warehouses Mississippi
Canada RMO Toronto Canada Shared Service Center El Paso, Texas Beauty Appliances El Paso, Texas Operating Division HQ Shared Service HQ Regional Market Org. HQ
U.S. HQ
62
Housewares/ Hydro Flask Bend, OR
63
64
The Company reports and discusses its operating results using financial measures consistent with accounting principles generally accepted in the United States of America (“GAAP”). To supplement its presentation, the Company discloses certain financial measures that may be considered non-GAAP financial measures, such as adjusted operating income, adjusted income, adjusted diluted EPS, EBITDA and adjusted EBITDA, which are presented in accompanying tables to this presentation along with a reconciliation of these financial measures to their corresponding GAAP-based measures presented in the Company’s consolidated statements of income.
65
Reconciliation of GAAP Diluted Earnings Per Share (EPS) to Adjusted Diluted EPS (non-GAAP)
(in thousands, except per share data)
66
FY 13 FY 14 FY 15 FY 16 FY 17 Diluted earnings per share (EPS) as reported (GAAP) $3.62 $2.66 $4.52 $3.52 $5.04 Asset impairment charges, net of tax $0.37 $0.28 $0.18 $0.30 CEO succession costs, net of tax $0.51 $0.16 Acquisition-related expenses, net of tax $0.08 $0.02 Venezuela re-measurement related charges, net of tax $0.65 Patent litigation charge, net of tax $0.62 $0.05 Sub total $3.62 $3.54 $4.88 $5.16 $5.39 Amortization of intangible assets, net of tax $0.69 $0.64 $0.79 $0.84 $0.87 Non-cash share-based compensation, net of tax $0.16 $0.32 $0.18 $0.25 $0.47 Adjusted diluted EPS (non-GAAP) $4.47 $4.50 $5.85 $6.25 $6.73 Weighted average shares of common stock used in computing diluted EPS (GAAP) 31,936 32,386 29,035 28,749 27,891 Dilutive impact of CEO succession costs
Weighted average shares of common stock used in computing adjusted diluted EPS (non-GAAP) 31,936 32,344 29,035 28,749 27,891
Reconciliation of Net Income to Earnings Before Interest, Taxes, Depreciation and Amortization (EBITDA) and Adjusted EBITDA
(In Thousands)
67
FY 13 FY 14 FY 15 FY 16 FY 17 Net Income $115,666 $86,248 $131,164 $101,228 $140,689 Interest expense, net $13,270 $10,128 $14,965 $10,981 $14,743 Income Tax expense $19,848 $20,886 $16,050 $18,590 $9,200 Depreciation and amortization, excluding amortized interest $34,425 $33,839 $39,653 $42,749 $44,341 EBITDA (Earnings before interest, taxes, depreciation and amortization) $183,209 $151,101 $201,832 $173,548 $208,973 CEO succession costs $18,228 $6,707 Non-cash share-based compensation charges $5,913 $14,232 $5,974 $8,483 $15,498 Acquisition-related expenses $3,611 $698 Venezuela re-measurement related charges $18,733 Patent litigation charge $17,830 $1,468 Non-cash asset impairment charges $12,049 $9,000 $6,000 $12,400 Adjusted EBITDA $189,122 $195,610 $220,417 $231,999 $238,339
Reconciliation of Net Income (GAAP) to Adjusted Income (non-GAAP)
(In Thousands)
68
FY 13 FY 14 FY 15 FY 16 FY 17 Net income as reported (GAAP) $115,666 $86,248 $131,164 $101,228 $140,689 Asset impairment charges, net of tax $12,034 $8,155 $5,312 $8,295 CEO succession costs, net of tax $16,335 $4,645 Acquisition-related expenses, net of tax $2,306 $696 Venezuela re-measurement related charges, net of tax $18,733 Patent litigation charge, net of tax $17,785 $1,464 Sub total $115,666 $114,617 $141,625 $148,399 $150,448 Amortization of intangible assets, net of tax $22,126 $20,741 $22,985 $24,063 $24,338 Non-cash share-based compensation, net of tax $5,055 $10,416 $5,313 $7,199 $13,102 Adjusted income (non-GAAP) $142,847 $145,774 $169,923 $179,661 $187,888
Reconciliation of Fiscal Year 2018 Outlook for GAAP Diluted EPS to Adjusted Diluted EPS (non-GAAP)
(Unaudited)
69
Diluted EPS, as reported (GAAP) $ 0.22 $ 4.32
4.65 $ 4.54
4.87 Asset impairment charges, net of tax 0.85
Subtotal 1.06 4.32
5.38
Amortization of intangible assets, net of tax 0.21 0.58
0.79
Non-cash share-based compensation, net of tax 0.10 0.23
0.33
Adjusted diluted EPS (non-GAAP) $ 1.37 $ 5.13
5.53 $ 6.50
6.90 Fiscal Year Ended February 28, 2018 Three Months Ended May 31, 2017 Outlook for the Balance of the Fiscal Year (Nine Months) Outlook for the Fiscal Year (Twelve Months)
70
Reconciliation of Non-GAAP Financial Measures – GAAP Operating Income (Loss) to Adjusted Operating Income (non-GAAP) (Unaudited)
(in thousands)
Operating income (loss), as reported (GAAP) $ 18,106 18.4 % $ 14,560 9.7 % $ (34,599) (109.4) % $ (1,301) (1.6) % $ (3,234) (0.9) % Asset impairment charges
32,000 101.2 % 4,000 5.0 % 36,000 10.0 % Subtotal 18,106 18.4 % 14,560 9.7 % (2,599) (8.2) % 2,699 3.4 % 32,766 9.1 % Amortization of intangible assets 644 0.7 % 2,786 1.9 % 1,838 5.8 % 1,417 1.8 % 6,685 1.9 % Non-cash share-based compensation 1,024 1.0 % 1,080 0.7 % 181 0.6 % 906 1.1 % 3,191 0.9 % Adjusted operating income (loss) (non-GAAP) $ 19,774 20.1 % $ 18,426 12.3 % $ (580) (1.8) % $ 5,022 6.3 % $ 42,642 11.9 % Operating income (loss), as reported (GAAP) $ 15,500 18.3 % $ 9,604 6.6 % $ (5,272) (14.7) % $ 3,066 3.8 % $ 22,898 6.6 % Asset impairment charges
5,000 13.9 % 2,400 3.0 % 7,400 2.1 % Patent litigation charge
1,468 1.0 %
1,468 0.4 % Subtotal 15,500 18.3 % 11,072 7.6 % (272) (0.8) % 5,466 6.7 % 31,766 9.1 % Amortization of intangible assets 657 0.8 % 3,538 2.4 % 1,571 4.4 % 1,438 1.8 % 7,204 2.1 % Non-cash share-based compensation 1,028 1.2 % 1,910 1.3 % 1,032 2.9 % 1,644 2.0 % 5,614 1.6 % Adjusted operating income (non-GAAP) $ 17,185 20.3 % $ 16,520 11.3 % $ 2,331 6.5 % $ 8,548 10.5 % $ 44,584 12.8 % Three Months Ended May 31, 2016 Housewares Health & Home Nutritional Supplements Beauty Total Three Months Ended May 31, 2017 Housewares Health & Home Nutritional Supplements Beauty Total
Net income as reported (GAAP) $ 5,868 $ 19,026 $ 0.22 $ 0.69 $ 0.22 $ 0.68 Asset impairment charges, net of tax 23,128 5,097 0.85 0.18 0.85 0.18 Patent litigation charge, net of tax
Subtotal 28,996 25,587 1.07 0.92 1.06 0.91 Amortization of intangible assets, net of tax 5,742 6,202 0.21 0.22 0.21 0.22 Non-cash share-based compensation, net of tax 2,701 4,093 0.10 0.15 0.10 0.15 Adjusted income (non-GAAP) $ 37,439 $ 35,882 $ 1.38 $ 1.29 $ 1.37 $ 1.27 Weighted average shares of common stock used in computing basic and diluted EPS 27,076 27,773 27,245 28,147 Three Months Ended May 31, Basic EPS Diluted EPS 2017 2016 2017 2016 2017 2016
Reconciliation of GAAP Net Income and Earnings Per Share (EPS) to Adjusted Income and Adjusted EPS (non-GAAP) (dollars in thousands, except per share data) (Unaudited)
71
EXPLANATION OF CERTAIN TERMS AND MEASURES USED IN THIS PRESENTATION
72
Throughout the accompanying presentation we refer to certain measures used by management to evaluate financial performance. We also may refer to a number of financial measures that are not defined under GAAP, but have corresponding GAAP-based measures. Where non-GAAP measures appear, we provide tables reconciling these to their corresponding GAAP-based measures and refer to a discussion of their use. We believe these measures provide investors with important information that is useful in understanding our business results and trends. 1. Accounts receivable turnover: Twelve-month trailing net sales revenue divided by the average of the current and prior four fiscal quarters’ ending accounts receivable balances. This result is divided into 365 to express turnover in terms of average days outstanding. 2. Adjusted diluted EPS (non-GAAP): Adjusted income divided by the weighted average shares of common stock outstanding plus the effect of dilutive securities.* 3. Adjusted income (non-GAAP): Net income as reported under GAAP excluding the following items net of their applicable tax effects: non-cash asset impairment charges, CEO succession costs, acquisition‐related expenses, Venezuelan re-measurement related charges, patent litigation charges, amortization of intangible assets, and non-cash share-based compensation, as applicable.* 4. Adjusted operating income (non-GAAP): Operating income for the Company or a segment as reported under GAAP excluding non-cash asset impairment charges, CEO succession costs, acquisition‐related expenses, Venezuelan re-measurement related charges, patent litigation charges, amortization of intangible assets, and non-cash share-based compensation, as applicable.* 5. Adjusted operating margin (non-GAAP): Adjusted Operating income for the Company or a segment divided by the related net sales revenue for the Company or a segment.* 6. Cash flow from operations: Same as net cash provided by operating activities in our consolidated statements of cash flows presented in our public filings. 7. Cash flow productivity (non-GAAP): The result, expressed as a percentage, of cash flow from operations minus capital expenditures, divided by reported net income. We currently use this as a metric to indicate the proportion of the cash we generate that can be made available for acquisitions, debt repayment, or shareholder repurchases. 8. Core business: Core business is net sales revenue and related operations associated with product lines or brands after the first twelve months from the date the product line or brand was acquired. Net sales revenue and related operations from internally developed product lines or brands are always considered core business.* 9. Corporate overhead costs: General corporate managerial and related administrative compensation costs, legal, accounting, and regulatory compliance costs, together with associated operating overhead that is not directly attributable to any one operating segment, but benefits the Company as a whole. These charges are allocated to each operating segment based upon a number of factors depending on the nature of the
and certain intangible asset levels held by each segment.
ratio.
shareholders’ equity. We use this as a leverage metric to indicate what proportion of debt and equity we are using to finance assets.
acquired and operated for less than twelve months during each period presented.
four fiscal quarters’ ending inventory balances.
due to the fixed nature of certain operating expenses.
for the Company or a segment.*
four fiscal quarters’ ending shareholders’ equity.
ending total debt plus shareholders’ equity.*
compute each segment’s operating income is directly associated with the segment. We then deduct allocations for operational shared services and corporate overhead costs. We do not allocate non-operating income and expense, including interest or income taxes to operating segments.*
the Company or a segment.
Many of the definitions below refer to terms also used in our Quarterly and Annual filings (“public filings”) with the SEC, however certain terms are used only in the accompanying presentation and these are noted with an *.