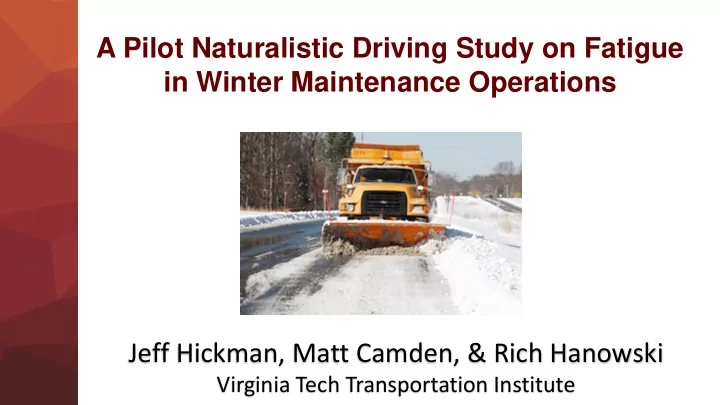

A Pilot Naturalistic Driving Study on Fatigue in Winter Maintenance Operations Jeff Hickman, Matt Camden, & Rich Hanowski Virginia Tech Transportation Institute
Overview of Project • Sponsored by Clear Roads • Goal: – Feasibility of naturalistic driving approach in winter emergencies
Literature Review Summary • Limited information • Fatigue/drowsiness in trucks – Heavy vehicle – Inconsistent, varying schedules – Long shifts • Fatigue in 15% to 30% of crashes
Naturalistic Driving Methods • 4 VDOT operators • 2 instrumented trucks • Drove for 3 consecutive months • 2 drove night shift, 2 drove day shift – 7p to 7a – 7a to 7p
Test Vehicles
Instrumentation • No experimenter present • Highly capable DAS – 5 cameras and various sensors • Data collected continuously • Detailed pre-crash/crash
How do we Measure Sleep?
Operator Instructions • Work/drive as you normally drive • Wear watch for three months • $100/month
Actigraph Data Analysis • Identify and mark any “bad data” episodes, • Convert data into minute-by- minute files, Flat line in data • Import all data into actigraphy database, and • Implement algorithm to identify sleep periods
Naturalistic Driving Data Reduction • Run triggers • Validate triggers • Classify event • Apply data directory
Time of Day 16 14 12 10 Percent 8 of SCEs 6 4 2 0 0 1 2 3 4 5 6 7 8 9 10 11 12 13 14 15 16 17 18 19 20 21 22 23 Hour of Day
Time on Task 20 18 16 14 12 Percent 10 of SCEs 8 6 4 2 0 0 1 2 3 4 5 6 7 8 9 10 11 Hours into Shift
Fatigue (ORD > 40) Total Number of Percent of SCEs Participant # Total Number SCEs with ORD ≥ Where Driver of SCEs 40 was Drowsy 1 52 33 63.5% 2 12 N/A N/A 3 16 0 0% 4 12 0 0% Total 92 33 35.9%
Actigraph Data Sleep during Daily Sleep Sleep 24 Consecutive Sleep 24 during Non- Hours Prior Participant # Daily Sleep Winter Hours Prior winter to a Winter Emergency to SCE Emergency Emergency Shifts 1 8.05 8.63 6.31 7.48 4.55 2 10.04 10.66 8.58 8.71 8.83 3 8.12 8.10 8.26 8.32 8.02 4 8.64 8.53 8.31 8.73 7.81 Average 8.71 8.98 7.87 8.31 7.30
Discussion • Fatigue was evident in SCEs – Mostly during winter emergency – Between 12:00 a.m. and 6:00 a.m. – Contributing factor in 28.3% • …but only for 1 driver • Less sleep during winter emergencies • Less sleep prior to a SCE
Limitations • Only 4 operators • Driving data only during winter emergencies • Specific to southwest VA • Mostly rural area • No daily logs
Future Research • Naturalistic driving data showed some interesting trends • Need more research – More instrumented trucks and operators – Log book to investigate naps – Drive during winter emergencies and regular hours – Technology/equipment that increases fatigue • Design an FMP for winter maintenance operators
Recommend
More recommend