JATA Market 59% Want JATA To Expand 1 In 6 Automobile Drivers - - PowerPoint PPT Presentation

jata market
SMART_READER_LITE
LIVE PREVIEW

JATA Market 59% Want JATA To Expand 1 In 6 Automobile Drivers - - PowerPoint PPT Presentation

JATA Market 59% Want JATA To Expand 1 In 6 Automobile Drivers Research Routes & Schedules Also Ride JATA! Study Throughout the County! Did you know? About 70% of study participants countywide consider JATA service to be important to


slide-1
SLIDE 1

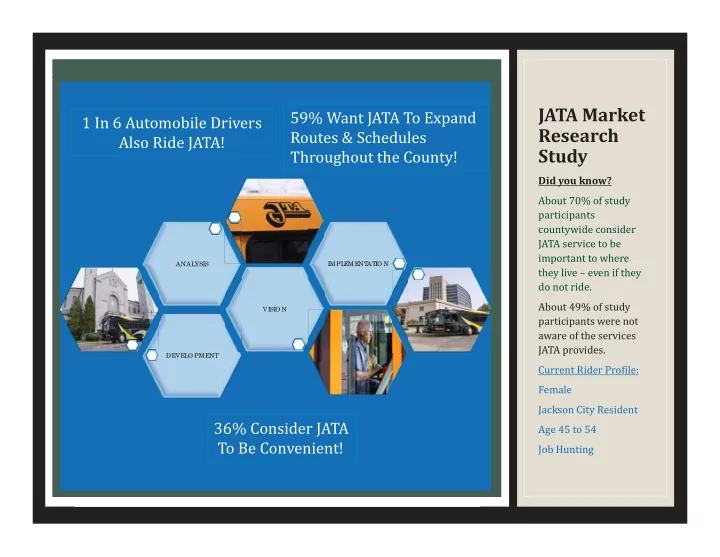
JATA Market Research Study

DEVELO PMENT VISIO N ANALYSIS IMPLEMENT AT IO N

Did you know? About 70% of study participants countywide consider JATA service to be important to where they live – even if they do not ride. About 49% of study participants were not aware of the services JATA provides. Current Rider Profile: Female Jackson City Resident Age 45 to 54 Job Hunting

1 In 6 Automobile Drivers Also Ride JATA! 36% Consider JATA To Be Convenient! 59% Want JATA To Expand Routes & Schedules Throughout the County!

slide-2
SLIDE 2

JATA Market Research Team

Market Research Study Team

RLS & Associates, Inc.

Providing Public Transit Consulting for Small Urban

and Rural Communities for 26 Years

Lockwood Research

Providing Opinion Research and Consultation for

Over Two Decades

Bergeron Marketing, LLC

Providing Marketing and Public Affairs Management

in Transit, Local Government, and Private Industry for Over 30 Years. A Michigan-based business.

slide-3
SLIDE 3

JATA Market Research Tasks

Initiated in Winter 2014/15

Task Number Task Description 1 Countywide Community Household and Business Survey 2 JATA Passenger Survey 3 Survey Results Report 4 Presentation of Survey Results to JATA Board 5 JATA Community Event – May 7, 2015

slide-4
SLIDE 4

STRATEGY & SUCCESS

slide-5
SLIDE 5

JATA’s Motivation for the Study

Planning and Prioritizing for the Future of

JATA

Identifying the Primary and Ancillary

Transportation Needs of Jackson Residents, Countywide

Using the Community’s Perspective to

Clarify the Focus of JATA

slide-6
SLIDE 6

Survey Successes

Results are Proportionate to Population

Distribution in 37 of 38 Jackson County Census Tracts

One Census Tract has 8 Addresses None Participated

Participation via Mail, Internet, and Phone Valid Passenger Survey Results

slide-7
SLIDE 7
slide-8
SLIDE 8

Survey Questionnaire Formation

Survey Questions were Developed with

Input from the Consulting Team and JATA Staff

Pilot Tested

January 2015

Executed

February 2- March 17, 2015

slide-9
SLIDE 9

Mixed-Mode Survey Methodology

Mailing Postcards

Toll-Free Phone Number Paper Survey Mailed Upon Request URL to an On-Line version of the Survey Stratified Random Sample Telephone Survey

Passenger Survey

Trained and Experienced Surveyors Intercepted Passengers at Key Bus Stops Paper Survey Format

slide-10
SLIDE 10

Number of Participants

Approach Responses On-Line Surveys Started/Completed 688/648 Paper Survey Mailed Upon Request/Completed 178/93 Toll-Free Phone Number Completed 181 Random Household Calls 370 On-Board Passenger Survey 316

Postcards = 922

Completed Surveys

Random Household

Calls = 370 Completed Surveys

Passenger Survey =

397 Completed Surveys

TOTAL: 1,689

slide-11
SLIDE 11

PASSENGER SURVEY

slide-12
SLIDE 12

Frequency of Riding JATA

66% OF RESPONDENTS RIDE JATA 11 OR MORE TIMES PER MONTH (FREQUENT RIDERS) 19% RIDE 6 TO 10 TIMES / MONTH 15% RIDE 1 TO 5 TIMES / MONTH

slide-13
SLIDE 13

Frequency By Trip Purpose

FREQUENT RIDERS USE JATA FOR ALL PURPOSES

slide-14
SLIDE 14

One-Way Commute

30%+ COMMUTE 45 TO 90 MINUTES 26% COMMUTE 30 TO 44 MINUTES 28% COMMUTE 15 TO 29 MINUTES 11% COMMUTE LESS THAN 15 MINUTES

slide-15
SLIDE 15

Distance to Bus Stop

40% LIVE LESS THAN ONE BLOCK

FROM A BUS STOP

34% TRAVEL 3 OR MORE BLOCKS TO A BUS STOP

slide-16
SLIDE 16

Transfers

slide-17
SLIDE 17

Vehicle Availability

slide-18
SLIDE 18

Customer Satisfaction

Rating Average Hours of Service 4.06 Days of Service 4.37 JATA Information is Easy to Find 4.72 Schedules are Easy to Read 4.88 Bus Fares are Reasonable 4.81 Buses are usually On-Time 4.30 Buses come Frequently Enough 4.62 Service Topics Rating Average Bus stops are Close to My Home 4.71 Sometimes I Miss My Connection 3.77 I Can Quickly Go Where I Want 4.45 Drivers are Courteous 4.68 Buses are Clean 4.74 Meets Needs of Rural Residents 4.46 JATA is a Valuable Resource 5.10 I Feel Safe & Secure Using JATA 5.06 Overall JATA Service Satisfaction 4.99 Service Topics

slide-19
SLIDE 19

Top 3 Priorities for 3 Years

Response Percent Response Count 68% 218 58% 187 55% 175 32% 104 20% 64 17% 54 15% 48 12% 37 12% 38 Improve fleet and facilities Improve safety and security Priority Topics Improve public awareness Expand route and schedule in county Improve information/website/signage Extend hours Reduce cost - - be more effective Expand route and schedule in city Improve quality and on time performance

slide-20
SLIDE 20

THE PEOPLE OF JACKSON COUNTY

slide-21
SLIDE 21

Socio-Economic Characteristics

RESPONDENT INCOME: 18% UNDER $15K 13% - $15K TO $25K 23% - $25K TO $50K 31% - $50K OR MORE RESPONDENTS WITH LOWER INCOME RIDE JATA MORE FREQUENTLY THAN RESPONDENTS WITH HIGHER INCOME

slide-22
SLIDE 22

Demographic Characteristics

MOST RESPONDENTS WERE AGE 35

OR OLDER

slide-23
SLIDE 23

Socio-Economic Characteristics

slide-24
SLIDE 24

Socio-Economic Characteristics

slide-25
SLIDE 25

JATA Passenger Profile

What Do We Think We Know About JATA Riders?

Mostly Female Job Seeking Lower-Income One-Person Household

slide-26
SLIDE 26

IMPORTANCE AND AWARENESS OF TRANSIT

slide-27
SLIDE 27

Importance of Transit Here

7 Of 10 Consider It Important To Have Transit Services Where They Live

slide-28
SLIDE 28

Availability of Transit Here

47% OF THOSE WHO SAID PUBLIC TRANSIT OPTIONS ARE EASILY ACCESSIBLE ARE NOT JATA RIDERS 43% OF RESPONDENTS SAID TRANSIT IS NOT ACCESSIBLE TO THEM / 36% SAID TRANSIT IS ACCESSIBLE TO THEM

slide-29
SLIDE 29

Awareness of Reserve-A-Ride

51% OF THE SAMPLE WAS AWARE THAT JATA PROVIDES DEMAND RESPONSE TRANSPORTATION PEOPLE CALLING

THE TOLL FREE # WERE MORE

LIKELY TO BE AWARE OF THE SERVICES (63%) PEOPLE ON-LINE

WERE MORE

LIKELY TO SAY

THEY WERE NOT

AWARE OF THE SERVICE (53%)

slide-30
SLIDE 30

Sources for JATA Information

4 OUT OF 5 COUNTY RESIDENTS DID NOT RESPOND TO THE QUESTION ABOUT SOURCES OF INFORMATION SUGGESTING A LACK OF KNOWLEDGE OR THOUGHT

ABOUT WHERE INFORMATION

CAN BE FOUND

slide-31
SLIDE 31

MOBILITY

slide-32
SLIDE 32

Transportation Mode

9% WHO WERE USING A PERSONAL AUTO ALSO RODE JATA 1 TO 5 TIMES IN

AN AVERAGE

MONTH

slide-33
SLIDE 33

Transportation Mode

Half of the Households that Used JATA Had No Vehicle in the Household 49% OF THE HOUSEHOLDS THAT USED JATA BUS AND 42% THAT USED RESERVE-A-RIDE HAD NO VEHICLE IN THE HOUSEHOLD

slide-34
SLIDE 34

Transportation Mode

JATA BUS RIDERS: 43% HAD 1 LICENSED DRIVER 26% HAD 2 LICENSED DRIVERS 26% HAD 0 LICENSED DRIVERS

slide-35
SLIDE 35

Need for Travel Assistance

74% for Personal Trips 72% Non-Emergency Medical 25% Work 10% School 17% Other

slide-36
SLIDE 36

SERVICE RATINGS

slide-37
SLIDE 37

JATA Service Ratings

8 OF 10 FIXED ROUTE RIDERS ARE SATISFIED 7 OF 10 RESERVE-A-RIDE RIDERS ARE SATISFIED THE MOST FREQUENT RIDERS WERE ALSO THE MOST SATISFIED RIDERS

slide-38
SLIDE 38

JATA Service Ratings Scale of 1-5

slide-39
SLIDE 39

JATA Service Ratings Scale of 1-5

slide-40
SLIDE 40

JATA Service Ratings Scale of 1-5

slide-41
SLIDE 41

Likely To Use Reserve-A-Ride If It Were Expanded

Overall: Most were “Neutral” to “Very Unlikely” to Use Expanded Reserve-A-Ride Those who “Never” Ride JATA were “Very Unlikely” (35%) to Use Reserve-A-Ride Frequent JATA Riders were “Very Likely” (40%) to Use Reserve-A-Ride Those Who Need Assistance were “Very Likely” (40%) to Use Reserve-A-Ride

slide-42
SLIDE 42

PRIORITIES

slide-43
SLIDE 43

Top 3 Priorities for 3 Years

slide-44
SLIDE 44

CONCLUSIONS

slide-45
SLIDE 45

Conclusions

Highest Level of Agreement with the

Statement: JATA is a valuable resource for the county.

Lowest Level of Agreement with the

Statement: JATA Service meets the needs of rural residents.

slide-46
SLIDE 46

Conclusions & Recommendations

Support Exists for JATA Service Expansions

But It Could Be Strengthened

Half of County Residents Do Not Know Enough

About JATA to Answer Detailed Questions About Service

One-Third Felt JATA Information Was Easy To

Find

Many Have Not Sought Out Information

slide-47
SLIDE 47

Conclusions & Recommendations

If JATA Is Able To Expand, The Information

Piece Will Become Even More Important As County Residents Will Need to Know Where and How to Ride

slide-48
SLIDE 48

Passenger Feedback: Top 3 Priorities for 3 Years

Response Percent Response Count 68% 218 58% 187 55% 175 32% 104 20% 64 17% 54 15% 48 12% 37 12% 38 Improve fleet and facilities Improve safety and security Priority Topics Improve public awareness Expand route and schedule in county Improve information/website/signage Extend hours Reduce cost - - be more effective Expand route and schedule in city Improve quality and on time performance

slide-49
SLIDE 49

Community Feedback: Top 3 Priorities for 3 Years

slide-50
SLIDE 50

Questions?

Please Ask Questions Throughout the Morning or Call / Email Us Later At Laura Brown, RLS & Associates, Inc. – Project Manager: (813) 482-8828 or lbrown@rlsandassoc.com Tammy Lockwood, Lockwood Research – Community Survey: tammy@lockwoodresearch.com Ed Bergeron, Bergeron Marketing, LLC – Marketing: Edward.Bergeron@charter.net