
SLIDE 1
Ch Chemical l and d Bi Biological l Re Responses s in n the e North h Fork k
- f
- f C
Clea ear C Creek F eek Fol
- llowing
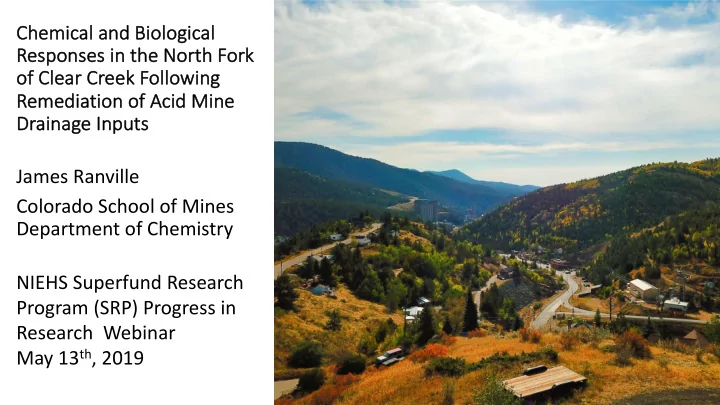
James Ranville Colorado School of Mines Department of Chemistry - - PowerPoint PPT Presentation
Ch Chemical l and d Bi Biological l Re Responses s in n the e North h Fork k of of C Clea ear C Creek F eek Fol ollowing g Re Remediation n of f Acid d Mine e Dr Drainage e Inputs s James Ranville Colorado School of
We wish to better understand how metal mixtures affect aquatic toxicology and metal bioavailability and how the presence of metal mixtures influence the remediation effectiveness for mining impacted waters We are using a laboratory and field based-approach. Laboratory studies of mixture toxicity utilize D. magna, with mortality, metal uptake (measured and computed by BLM), and gene expression as endpoints. Bioavailability of metals from sediments utilize 65Cu isotope labeling with snails as the test organism. We are directly measuring the biological and chemical responses to remediation of the mining effluents (todays presentation).
(NFCC) located 50 km west of Denver, Colorado USA
mining solid wastes (sulfide weathering)
Zn) enter stream effecting water column and sediment chemistry
(absent)
Photo Credit: Heather Henry
Flow Flow
Gauge
500 1000 1500 2000 2500 M a r
7 M a y
7 J u l
7 S e p
7 N
7 J a n
8 M a r
8 M a y
8 J u l
8 S e p
8 N
8 J a n
9 M a r
9
Sampling Dates
Scouring Scouring Base Flow Base Flow
March 23 May 1 May 16 August 29 October 27
March 28: treatment of one source begins, periodic shutdowns occur, second source treatment begins in July September 15: 24/7 treatment begins
0.01 0.1 1 10 100 1000 Aug-16 Mar-17 Sep-17 Apr-18 Oct-18 May-19
Load (Kg/day)
0.01 0.1 1 10 100 1000 Aug-16 Mar-17 Sep-17 Apr-18 Oct-18 May-19
0.01 0.1 1 10 100 1000 Aug-16 Mar-17 Sep-17 Apr-18 Oct-18 May-19
Spring Scouring Event
Pre- Treatment Pre- Treatment Pre- Treatment Post-Treatment Post-Treatment Post-Treatment
REF 1 REF 2 ANT RAP TP Flow
20 40 60 80 100
REF 1 to REF 2 REF 2 to ANT ANT to RAP
Percent Increase Between Sites Cu Zn BDL
REF 1 REF 2 ANT RAP TP Flow RBP ARG USGS
5 10 15 20 25
Aug-16 Nov-16 Mar-17 Jun-17 Sep-17 Dec-17 Apr-18 Jul-18 Oct-18 Feb-19 May-19
Total Iron (mg/L) Post-Treatment Pre-Treatment
5 10 15 20 25 30 35 40 45
Aug-16 Nov-16 Mar-17 Jun-17 Sep-17 Dec-17 Apr-18 Jul-18 Oct-18 Feb-19 May-19
Pre-Treatment Post-Treatment
10 20 30 40 50 60 70 80 90 100 0.01 0.1 1 10 100
Percent Dissolved Copper Particulate Iron (mg/L)
Stumm 1992 Pre-remediation
20 40 60 80 100 M a r
7 M a r
7 M a y
7 J u n
7 A u g
7 S e p
7 O c t
7 N
7 J a n
8 A p r
8 M a y
8 J u l
8 A u g
8 S e p
8 O c t
8 N
8
Dilution Dilution Base Flow Base Flow
Treatment Plant
Flow direction
Golden 30 km
stream parameters
processes that drive post- remediation stream conditions
effectiveness for stream ecological health
”Recovery” Sites ”Impact” Sites