
SLIDE 1
31500 Northwestern Highway, Suite 300 Farmington Hills, Michigan 48334 248.350.9900 www.rgpt.com
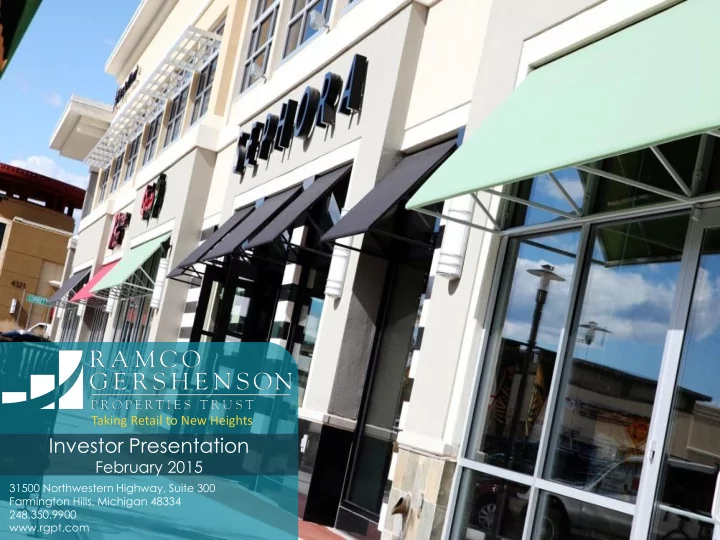
Investor Presentation
February 2015
Taking Retail to New Heights
Investor Presentation February 2015 31500 Northwestern Highway, - - PowerPoint PPT Presentation
Taking Retail to New Heights Investor Presentation February 2015 31500 Northwestern Highway, Suite 300 Farmington Hills, Michigan 48334 248.350.9900 www.rgpt.com RPT Company Overview Ramco-Gershenson Properties Trust owns and manages
31500 Northwestern Highway, Suite 300 Farmington Hills, Michigan 48334 248.350.9900 www.rgpt.com
February 2015
Taking Retail to New Heights
2
manages interests in 80 market dominant, multi-anchored community shopping centers primarily in a dozen major metropolitan markets.
tenanted by best-in-class national and regional retailers, including TJ Maxx, Marshalls, LA Fitness, Bed Bath & Beyond, The Home Depot, Nordstrom Rack, Ross Dress for Less, Kohl’s, and Stein Mart.
260,000 square feet with five national anchors
grocer, including Whole Foods, Publix, and Kroger, that generate average annual sales
sheet with an investment grade profile and significant liquidity to support its growth initiatives highlighted by a net debt to EBITDA ratio of 5.9x.
Woodbury Lakes – Woodbury, MN
3
Bridgewater Falls, Hamilton, OH
shopping centers in trade areas with average household incomes of $85,500 tenanted by best-in-class retailers that pay
average household incomes of $65,200 and average base rents of $8.69.
total cost of $51 million which are expected to produce incremental returns of 10-11%.
highlighted by same-center growth of 3.3%, core portfolio occupancy of 95.5%, and comparable leasing spreads of 6.3%.
debt to EBITDA of 5.9x and fixed charge cover of 3.0x.
4
A. Focused on Market Dominant Community Centers B. RPT’s High-Quality Retailers C. A Community Focused Approach D. Managing for Sustainability E. Building Quality-Delivering Results
5
Deerfield Towne Center – Mason, OH
Note: As of December 31, 2014. GLA and anchor count includes shadow anchor space.
6
Dominant Multi-Anchored Community Centers Strong Demographics Creditworthy Tenants Comparable Leasing Spreads 6.3% 90% National/Regional 5-Mile Income of $78,000 5-Mile Population of 170,000 80% of Base Rent 5 Anchors Per Center Averaging 260,000 Square Feet
Shops at Old Orchard, West Bloomfield, MI
7
Note: As of December 31, 2014.
tenant line-up is dominated by national destination oriented retailers providing stability in any economic environment.
national retailers with strong credit and growth profiles.
national tenants, the Company leases to the most current regional and local concepts to strengthen each center’s merchandise mix.
4.5% of ABR
2.6% of ABR 2.5% of ABR 1.8% of ABR 1.8% of ABR 1.7% of ABR 1.6% of ABR 1.5% of ABR 1.5% of ABR 1.4% of ABR
8
Front Range Village – Fort Collins, CO
Right mix of best-in-class national tenants and exciting regional and local retailers that drive traffic to the center and are unique to each community’s tastes and interests.
Inviting environments to increase time spent at each center, improve shopper experience, and promote customer loyalty.
Identify and create opportunities that along with our “RPT Signature Events” will solidify the center’s importance within the Community.
9
considering and responding to the impact of the Company’s business activities as it relates to its key stakeholders.
impact of owning and managing shopping centers. Everyday thousands of people visit a Ramco property creating a significant impact on both the social and environmental landscape. RPT’s Active Environmental Sustainability Initiatives Include:
rain sensor installation.
The Shoppes at Fox River – Waukesha, WI Deerfield Towne Center – Mason, OH Nagawaukee Center – Waukesha, WI
Increasing Average Base Rents
1.4% 3.3% 3.0% 3.3%
0.0% 1.0% 2.0% 3.0% 4.0% 2010 2011 2012 2013 2014 Generating Same-Center NOI Growth $10.98 $11.32 $11.54 $12.35 $13.00 $10.70 $11.20 $11.70 $12.20 $12.70 $13.20 2010 2011 2012 2013 2014
10
RPT has successfully transformed its portfolio over the last five years evidenced by its commitment to ever increasing average base rents and generating strong same- center NOI growth.
A. Focused on 12 Top Metropolitan Markets B. 2014 High-Quality Acquisitions C. Capital Recycling Drives Quality and Value
11
Woodbury Lakes – Woodbury, MN
Minnesota #16 Minneapolis –
3.2% of ABR
#19 MSA 6.0% of ABR Chicago #3 MSA 4.1% of ABR Cincinnati #28 MSA 9.5% of ABR Denver #21 MSA 7.5% of ABR SE Michigan #14 MSA 24% of ABR Toledo #89 MSA 3.3% of ABR Atlanta #9 MSA 3.7% of ABR Jacksonville #40 MSA 5.9% of ABR Tampa Bay #18 MSA 5.8% of ABR SE Florida #8 MSA 11.3% of ABR Milwaukee #39 MSA 5.1% of ABR
12
RPT’s top 12 metropolitan markets account for nearly 90% of its pro rata annualized base rents. The Company is focused on top MSAs; 11 of the Company’s targeted 12 markets are in the top 40 MSAs in the US. Taken together, the12 MSAs are home to 121 Fortune 500 company headquarters and 42.7 million people.
Michigan now accounts for only 29% of the Company’s rents.
The Company invested $322 million in market dominant, multi-anchored shopping centers with significant value-add potential which builds earnings growth and enhances portfolio quality.
Woodbury Lakes – Woodbury, MN Buttermilk Towne Center – Crescent Springs, KY Bridgewater Falls - Hamilton, OH
Minnesota #16 Minneapolis – St. Paul Cincinnati #28 MSA Denver #21 MSA
13
Front Range Village – Fort Collins, CO
ABR: $8.5 million $19.38 psf TOTAL GLA: 792,945 (Owned: 459,307) MAJOR TENANTS: ABR: $2.5 million $9.15 psf TOTAL GLA: 277.533 MAJOR TENANTS: ABR: $6.6 million $13.93 psf TOTAL GLA: 627,202 (Owned 503,502) MAJOR TENANTS: ABR: $5.7 million $21.38 psf TOTAL GLA: 317,603 (Owned 305,086) MAJOR TENANTS:
Quality Markers
psf of $15.96
Income of $85,500
Nagawaukee Center, Milwaukee, WI
14
Foot
Income
Population
Feet
Household Income
Population
Feet
RPT’s capital recycling
has resulted in a much higher-quality shopping center portfolio:
growth of over 30%.
Center NOI Growth of
Profile with Average Household Incomes of $78,000.
from Operations of over 20%.
approximately 35%.
A. Redevelopment and Releasing Projects B. Case Studies - Redevelopments C. Case Study - Development
15
Lakeland Park Center – Lakeland, FL
16 Project Location Estimated Project Costs Expected Return
Investment = Expected Net Increase in Value Village Plaza Lakeland, FL $4.4 million 8%-9% $0.6 million Promenade at Pleasant Hill Duluth, GA $6.6 million 14%-15% $6.9 million Merchants’ Square Carmel, IN $6.4 million 10%-11% $3.0 million Harvest Junction North Longmont, CO $7.8 million 9%-10% $3.6 million Deer Grove Centre Palatine, IL $3.6 million 8%-9% $1.1 million Winchester Center Rochester Hills, MI $2.8 million 14%-15% $2.5 million The Shoppes at Fox River Waukesha, WI $19.5 million 9%-10% $7.9 million Total all Projects $51.1 million 10%-11% $25.6 million
class retailers, placemaking, common areas, and maximizing the community focus of each center.
incremental investment of 10-11% and delivering at least $5.1 million of NOI upon stabilization.
17
multi-anchored center in Carmel, Indiana, an affluent sub-market
anchored and encompasses 328,000 square feet.
is the latest addition to the shopping center, which has undergone numerous improvements in the past three years. Value Creation
expected to produce an incremental return on investment
Merchants’ Square Carmel, Indiana
18
were acquired in the second quarter of 2012 encompassing 471,000 square feet.
Company acquired 15 acres of adjacent land to expand the shopping center.
include fashion and fast casual dining options as well as service uses. Value Creation
expected to produce an incremental return on investment of 9-10%.
Harvest Junction Longmont (Boulder), Colorado
19
acquired in December of 2010 encompassing 236,000 square feet.
ULTA, rue 21, Charming Charlie, and Hobby Lobby on 12 acres of land that was part of the initial acquisition.
10 acres encompassing 110,000 square feet. Value Creation
million expected to produce an incremental return on investment
The Shoppes at Fox River Waukesha (Milwaukee), Wisconsin
Possible Future Expansion
20
Parkway Shops Jacksonville, Florida
encompasses 90,000 square feet and is anchored by Dick’s Sporting Goods, Marshalls, and ULTA Beauty.
with Hobby Lobby in 55,000 square feet to anchor Phase II of the project.
million (Phase II) expected to produce a return on investment of 8%-9%.
A. Solid Capital Structure B. Proactive Balance Sheet Management C. Investment Grade Profile
21
Shops on Lane Avenue – Upper Arlington, OH
22
Note: As of December 31, 2014.
billion conservatively structured with $1.5 billion in common equity.
REIT funds and other institutional investors.
14%.
capitalization is 40%.
Senior Unsecured Debt (2018- 2025) 20% Line of Credit (2016) 1% Mortgage Loans (due various dates) 14%
Notes (2038)/Capital Lease Obligation 1% 7.25% Convertible Preferred Stock 5% Common Equity 59%
$0 $50 $100 $150 $200 $250 $300 2014 2015 2016 2017 2018 2019 2020 2021 2022 2023 2024 2025 2026 2027+ Millions Mortgage Unsecured JV RPT Debt Maturity by Year
New York Life
23
Note: As of December 31, 2014.
24
River City Marketplace, Jacksonville, FL Hunter’s Square, Farmington Hills, MI
Low Leverage Flexible Structure Net Debt / Market Capitalization 36% Unencumbered Operating Assets/Unsecured Senior Debt 2.9X Net Debt + Preferred / Market Capitalization 40% Fixed-Rate Debt / Total Debt 96% Net Debt to EBITDA 5.9X Secured Debt / Total Capitalization 14% Strong Coverage Ample Liquidity Interest Coverage 3.9X Revolving Line Availability $336 Fixed Charge Coverage 3.0X NYL Investors, LLC (New York Life) Agreement $100 Prudential Capital Shelf Agreement $50
Harvest Junction, Longmont, CO Note: As of December 31, 2014.
25
center portfolio comprised of large, market dominant shopping centers expected to produce strong rental and sustainable same-center NOI growth.
capital recycling program focused
that will drive quality and growth.
and in-process developments featuring leading retail anchors, which will contribute to earnings growth.
liquidity to fund its business plan and grow its dividend.
Town & Country Crossing, Town & Country, MO