
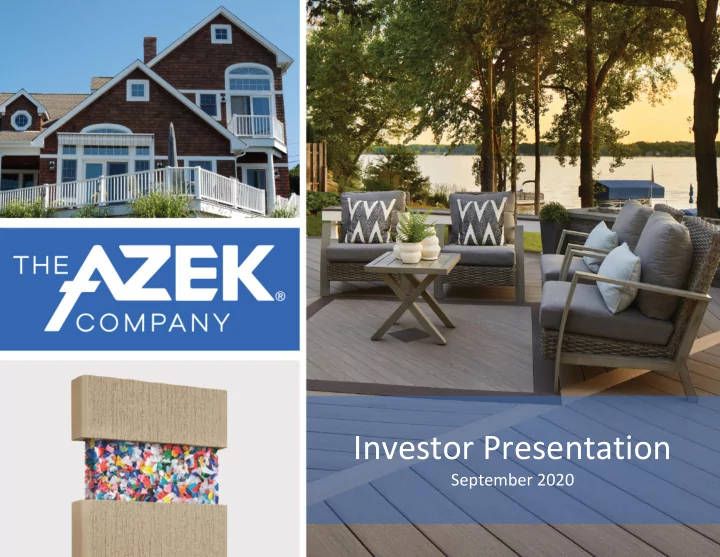
SLIDE 1
Investor Presentation September 2020 Disclaimer Important Notice - - PowerPoint PPT Presentation
Investor Presentation September 2020 Disclaimer Important Notice Some statements made in this presentation may constitute forward -looking statements within the meaning of the federal securities laws. Forward-looking statements can be
Important Notice Some statements made in this presentation may constitute “forward-looking statements” within the meaning of the federal securities laws. Forward-looking statements can be identified by the fact that they do not relate strictly to historical or current facts, but rather are based on current expectations, estimates, assumptions, forecasts or projections about the company’s industry and the company’s business and financial results. Forward-looking statements often include words such as “anticipates,” “estimates,” “expects,” “projects,” “forecasts”, “intends,” “plans,” “believes”, “suggest”, “estimate”, “target”, “should”, “could”, “would”, “may”, “might”, or “will” and words and terms of similar import. Forward-looking statements involve known and unknown risks, uncertainties and other factors, many of which are outside our control. Forward-looking statements include, but are not limited to, statements about our market opportunity and the potential growth of that market, the potential impact of the COVID-19 public health pandemic, our strategy,
achievements may vary materially from those stated in, or implied by, any forward-looking statements, and the assumptions on which forward-looking statements are based may prove to be incorrect. Factors and uncertainties that might cause such differences in such forecasts and projections and other forward-looking statements include, but are not limited to: the fact that our business, financial condition and results of operations are being, and are expected to continue to be, adversely affected by the current COVID-19 pandemic, the fact that demand for our products is significantly influenced by general economic conditions and trends in consumer spending on outdoor living and home exteriors; risks associated with us competing against other manufacturers; risks related to the seasonal nature of certain of our products and the impact of changes in weather conditions and product mix; our ability to develop and introduce new and improved products; our ability to effectively manage changes in our manufacturing process; risks related to our ability to accurately predict demand for our products and to maintain relationships with key distributors or other customers; risks related to shortages in supply, price increases or deviation in the quality of raw materials; our ability to retain management; risks related to acquisitions or joint ventures; our ability to maintain product quality and product performance and potential exposures resulting from our product warranties; our ability to ensure that our products comply with local building codes and ordinances; risks arising from the material weaknesses we have identified in our internal control over financial reporting; and our ability to maintain an effective system of internal controls. Other risks may also cause actual results to differ materially from those projected by any forward-looking statements. New factors emerge from time to time and it is not possible for us to predict all such factors, nor can we assess the impact of any such factor on our business or the extent to which any factor, or combination of factors, may cause results to differ materially from those contained in any forward-looking statement. The forward-looking statements made in this presentation relate only to events as of the date on which such statements are made. We disclaim any intention and undertake no obligation to update or revise any forward-looking statements after the date of this presentation or to conform such statements to actual results or revised expectations, except as required by law. Given these risks and uncertainties, readers are cautioned not to place undue reliance on such forward-looking statements. In addition, while we believe the industry and market data included in this presentation were based on reasonable assumptions when prepared, the industry and market data involve risks and uncertainties and are subject to change based on various factors. The COVID-19 pandemic may materially affect the growth of various of the markets discussed in this presentation, and we cannot predict the extent to which these estimates will be affected. These and other factors could cause results to differ materially from those expressed in, or implied by, the estimates made by independent parties and by us. Non-GAAP Measures This presentation (i) contains non-GAAP measures, (ii) uses terms which are not generally used in presentations made in accordance with GAAP, (iii) uses terms which are not measures of financial condition or profitability and (iv) contains terms which are unlikely to be comparable to similar measures used by other companies in our industry. As a result, these financial measures have limitations as analytical and comparative tools and you should not consider these items in isolation, or as a substitute for analysis of our results as reported under GAAP. For a reconciliation of non-GAAP measures used in this presentation to the closest comparable GAAP measure, see the Appendix hereto.
2
Large, high growth markets benefitting from long-term material conversion, favorable secular trends in Outdoor Living and stable R&R demand through economic cycles
1. AZEK Integrated Management System (AIMS).
Resilient, Growing Markets with Material Conversion Branded Category Leader in Well-Structured Markets Multiple Levers to Drive Growth Attractive Margins with Significant Upside Well known in the industry as a leader in innovation generally holding #1 or #2 market positions in core product categories Driving above-market growth and accelerating conversion through new products, leveraging downstream-focused salesforce and increased retail penetration Customer value proposition and vertically integrated, U.S. manufacturing base drives attractive margins with significant upside from recent investments in recycling and continuous improvement initiatives (including AIMS) (1) Category leader in sustainable building products focused on recycling plastic waste, preserving natural resources and utilizing energy-efficient manufacturing processes Sustainability is at Our Core Execution-Focused Management Team Diverse management team with significant public company and industry experience executing goal-orientated strategic roadmap
4
We are an industry-leading manufacturer
products and we are committed to accelerating the use of recycled materials
Beauty Sustainability Material Science Low Maintenance Expand Market Accelerate Conversion Core Value: Always Do The Right Thing Drives Everyday Behavior
LEADING THROUGH INNOVATION
ALWAYS DO THE RIGHT THING
We make homes and structures more beautiful and more useful with leading-edge sustainable products We are positioned to profitably grow the overall market, the category and our presence by engineering new products that accelerate conversion to better performing materials We leverage our material science to create premium branded products that are stylish, long-lasting, low-maintenance and sustainable
PURPOSE PROOF THE PATH AHEAD
Who We Are Why We’re Different Where We’re Going
5
Inaugural ESG report with key objectives to be issued in early 2021
Recycle Social Environmental Governance
Nearly 300mm lbs. of waste and scrap diverted from landfills in 2019 through our recycle program ~98% of scrap re-used ~80% and ~50% of the content in our TimberTech capped composite and capped polymer decking products, respectively, is recycled material ~44% of extruded materials from recycle in 2019, and we expect this to increase to ~54% in 2020 Separate Board Chair and Chief Executive Officer 30% gender / ethnic diversity on Board of Directors Committed to diversity and sound governance; created ESG Steering Committee comprised of internal cross- functional leaders ESG strategy oversight by Board of Directors Majority of Residential products are recyclable at the end of their useful lives Engaged third parties to complete Life Cycle Assessment of our products and carbon footprint evaluations Efficient water usage – closed-looped water filtration systems that recycle ~96% of water used Chicago HQ: LEED Certified 2019 Focus on Safety – 45% improvement in reportable events since 2016 Committed to diversity: – 50% executive team gender / ethnic diversity Engaged employee base; employees granted celebratory shares at IPO Manufactured in the U.S. Expanded and adopted ESG policies and mission statements involving safety and welfare of employees
6
Note: Financial metrics represent LTM 6/30/20. 1. Segment Adj. EBITDA contribution percentages exclude the impact of corporate and unallocated costs.
COMMERCIAL
16% LTM NET SALES | 8% LTM ADJ. EBITDA (1)
Decking Rail Exteriors Vycom Scranton Products Accessories RESIDENTIAL
84% LTM NET SALES | 92% LTM ADJ. EBITDA (1)
7
Industry leading manufacturer with resilient business model built over many years
$131 $150 $180 $200 20.7% 22.0% 22.6% 23.5% 2017 2018 2019 LTM 6/30 $633 $682 $794 $851 7.8% 16.5% 10.5% 2017 2018 2019 LTM 6/30 ($ in millions)
Decking, Rail & Accessories 58% Exteriors 25% Commercial 17%
Product
Residential R&R 66% Commercial 17% Residential New Construction 17%
Application
Source: Company information and management estimates. Note: FY ended September 30. Refer to Appendix for reconciliation for Adjusted EBITDA and Adjusted EBITDA Margin.
$851mm / 10.5%
LTM 6/30 Net Sales / YoY % Growth
$200mm / 23.5%
LTM 6/30 Adj. EBITDA / % Margin
BROAD & COMPLEMENTARY PORTFOLIO LEADER IN BRANDED OUTDOOR LIVING PRODUCTS AZEK BY THE NUMBERS
(2019 Net Sales)
STRONG MOMENTUM & IMPROVING PROFITABILITY
Net Sales Adjusted EBITDA YoY Sales Growth / Adjusted EBITDA Margin +275 bps margin improvement 11.4% CAGR
▪ Headquartered in Chicago, IL with facilities in OH, PA and MN ▪ ~1,550 employees ▪ ~200 direct sellers ▪ 130+ distributor branches ▪ 4,200+ pro dealers ▪ ~98% of sales in N.A. ✓ 30-year history with legacy of product innovation ✓ 20+ years in decking and trim ✓ Created branded trim category ✓ Multi-year strategic growth & margin expansion plan underway ✓ Investments in sales, marketing, Lean Six Sigma and recycling
8
Market Conversion Product Innovation Retail Expansion AZEK Integrated Management System (AIMS) & Recycling Consumer Journey
Accelerating Performance
Growth Margin Strategic M&A Brand Integrated Manufacturing Material Science Customer Connection
Attractive Margins
Material Conversion Outdoor Living
Powerful Tailwinds
R&R Focus Sustainability
ATTRACTIVE MARKETS CORE STRENGTHS FOCUSED STRATEGY
9
Executing on multi-year strategy and still in the early innings
–
Q3 2020: Residential segment net sales increased 5.5% year-over-year; June sales increased 15% year-over-year
–
Q3 2020: Deck, Rail & Accessories net sales increased over 9% year-over-year
–
Engagement: Digital interaction, sample orders and new dealer, contractor and architect conversions seeing continued momentum
–
Demand accelerated in June driving strong sell-through growth; robust demand continuing in July 2020
–
Q3 2020: Adjusted EBITDA increased 9.6% year-over-year; Adj. EBITDA Margin expanded 200bps year-over-year
–
Balance sheet significantly strengthened as IPO net proceeds primarily used to pay down debt
–
Expanding capacity plan from $100mm to approximately $180mm to support market demand and wood conversion
–
Adds an incremental 70% decking production capacity and new manufacturing facility over next 18 to 24 months
–
Fiscal Q4 2020 net sales growth in range of 12% to 17% YOY and Adjusted EBITDA growth in range of 14% to 19% YOY
–
Fiscal Q1 2021 net sales growth outlook for Residential segment of low double-digit growth year-over-year
10
Core $7.6 billion market; AZEK material types expected to grow at a ~7% CAGR (or >1.5x market) driven primarily by conversion
Source: Principia DemandBuilder data. Principia’s Trim market definition excludes broader applications such as tongue and groove profiles, sheets, thresholds and column wraps. Note: Material share %’s are based on volume demanded in billions of linear feet. Decking, Rail and Trim conversion opportunity is based on volume demanded for wood solutions in billions of linear feet. Trim conversion opportunity also includes engineered wood (~17% of total trim market). Other includes (A) hollow vinyl, plastic lumber and metal for decking, (B) iron, stainless steel, hollow vinyl and other plastic for railing and (C) engineered wood, fiber cement, vinyl, other polymer composite and other for trim. 1. AZEK material types for decking category includes composite and PVC decking, rail category includes composite and aluminum rail, and exterior trim category includes PVC trim. 2. Includes premium hardwoods, cedar and redwood. 3. Principia estimates. 4. North America Deck & Rail Association (NADRA) estimates.
AZEK products are accelerating conversion from traditional materials such as wood – significant runway remaining
Decking Market: 5% CAGR AZEK Material Types: 8% CAGR
(1)
Decking – $3.3B
Exterior Trim Market: 2% CAGR AZEK Material Types: 3% CAGR
(1)
Exterior Trim – $2.1B
(’19 – ’22E)
Rail Market: 4% CAGR AZEK Material Types: 6% CAGR
(1)
Railing – $2.2B
(’19 – ’22E) (’19 – ’22E) Composite 20% Other 2% Premium Wood 13% Other Wood 65%
Early innings of long-term material conversion trend
+58%
Conversion Opportunity
Composite & Aluminum 16% Other 17% Wood 67% PVC 11% Other 47% Wood 41%
+78%
Conversion Opportunity
+67%
Conversion Opportunity ~58mm installed decks(3) in the U.S., many of which are wood and nearly half of them are beyond their useful life(4) 17.6% 18.5% 20.2% 2017 2018 2019
Composite Decking Gaining Share (% of total market linear feet)
(2)
12
Value proposition, consumer engagement and education drive conversion
$8.6 $9.0 $7.9 $7.6 $0.7 $1.4
Source: Management estimates. 1. These assumptions and estimates are based on AZEK market knowledge and feedback from decking-focused contractors with experience installing TimberTech and wood decking products. Actual costs for any particular installation can vary significantly. Assumes pressure treated lumber deck board pricing of $0.87 per linear foot based on December 2019 average. 2. Total Deck Project Installation Costs represent the total aggregate costs of an initial deck installation for a 16’ x 20’ elevated deck and exclude costs associated with the installation of rail or stairs. 3. Total Deck Life-Cycle Costs represent both the aggregate costs of an initial deck installation and the estimated maintenance costs over a 25-year period for a 16’ x 20’ elevated deck excluding potential replacement costs.
AZEK’s products offer a compelling value proposition: superior aesthetics, durability, ease-of-installation, reduced maintenance and lower total lifecycle costs
$8.6K $9.0K $18.8K $11.8K
Pressure Treated Lumber
Labor and Other Costs Decking Material Costs Installation Costs Maintenance Costs
$10.2 $2.8
Pressure Treated Lumber
EDGE Prime+ Trading up to a better-looking multi-colored board would
extra ~$300
EDGE Prime (Mono) EDGE Prime (Mono)
$9.3K
ACCELERATING CONVERSION INSTALLATION COST (1) (2) LIFECYCLE COST (1) (3)
~15% of total cost attributed to deck materials >35% savings in total lifecycle costs
13
Decks
The Outdoor Living market is poised to benefit from an increased focus on the home and suburban living
Indoor / Outdoor Spaces Outdoor Kitchens Pergolas
Homeowners are adding decks and renovating patios to create entertaining and living spaces that add more functional square footage; the broader Outdoor Living category represents an ~$18 billion(1) opportunity
1. Total U.S. market sales of wood and wood-look siding, pavers, outdoor furniture and outdoor lighting were $10.9 billion in 2018 according to Freedonia, and, when combined with the total U.S. market sales of deck, rail and trim according to Principia in 2019, represent an approximately $18 billion market. 2. The American Institute of Architects (AIA) Q2 2020 Home Design Trends Survey; % of firms reporting “increasing” minus % reporting “decreasing”
SELECT OUTDOOR LIVING SPACES
14
53% 48% 26% 23% Outdoor living space Blended indoor / outdoor space Outbuildings (e.g. barns, sheds) Exterior / Security Lighting
Outdoor Living Space Blended Indoor / Outdoor Space Exterior / Security Lighting
#1 #2 #3 AIA SURVEY: OUTDOOR LIVING POPULARITY (2) #4
Outbuildings (e.g. barns, sheds)
EXTERIOR TRIM Leading positions in decking and exteriors markets – both are transitioning away from traditional wood materials
4.8 5.0 5.1 5.7 5.8 5.8
Source: Company data, REMODELING Magazine and BUILDER Magazine are owned by 2020 Hanley Wood Media, Inc. (Decking: Composite/PVC and Exterior: Decorative Mouldings/Trim/Columns categories), Houzz, Pro Remodeler and Dwell. Note: Quality Ratings in above bar charts are based on a 7-point scale, with 7 representing the highest brand quality.
#2 #3
5.3 5.3 5.3 5.3 5.5 5.8
#1
DECKING
Company A Company B Company D Company E Company B
2019 Remodeling Brand Use Report – Highest Overall Quality 2019 Remodeling Brand Use Report – Highest Overall Quality
Company F Company C
15
RECENT AWARDS & RECOGNITIONS
✓ 2020 Builder Brand Use Study: − TimberTech Decking ranked #2 in brand familiarity − AZEK Trim ranked #1 in overall quality, brands used in the past 2 years & brands used the most ✓ 2019 Builder Brand Use Study: − TimberTech AZEK Decking ranked #1 in overall quality − AZEK Trim ranked #1 in overall quality ✓ Houzz: TimberTech won Houzz’s Best of Design for four years in a row (2017-2020) ✓ Pro Remodeler: Top 100 Products for 2020 / Decks and Porches (August 2020) – AZEK Vintage Decking Collection ✓ Dwell: Best Outdoor Products to Elevate Your Lakeside Retreat (May 2020) – PRO Reserve Decking Collection ✓ Also ranked #1 for brand used most and brand familiarity
Trex James Hardie
4-Sided Capped Composite Decking
$6.00 $5.00 $3.75 $2.50 $1.85
GOOD BETTER BEST PREMIUM
Harvest $3.39–$3.79 Arbor $4.09–$4.49 Vintage $5.19–$5.59 Terrain $2.25–$3.19 Reserve $3.79–$4.19 Legacy $4.09–$4.49 Prime $1.85–$2.25 Premier $2.35–$2.50 Prime+ $2.50–$2.75 2019 product launches 2020 product launches
Broad and balanced approach accelerates material conversion across a wide range of price segments
($/linear foot)
Source: Company data and surveys.
Capped Polymer Decking 3-Sided Capped Composite Decking 25-Year Limited Fade & Stain / 25-Year Limited Lifetime Product 3-Sided Capped Composite Decking Scalloped Board Profile 50-Year Fade & Stain / Limited Lifetime Product Capped Polymer Decking Unique & proprietary capped polymer technology leads to a cooler, lighter board 30-Year Fade & Stain / 30-Year Limited Lifetime Product 4-Sided Capped Composite Decking Full Board Profile New product in 2020
Mahogany
VINTAGE
COLLECTION Antique Leather
RESERVE
COLLECTION
PRIME+
COLLECTION Coconut Husk
16
Example Visuals & Differentiated Technology
Broad portfolio that enhances curb appeal, contractor productivity and wood conversion
A market leader in Exteriors offering a full line of trim and moulding, value-added and paintable solutions
WINDOW TRIM CROSS HEAD MOULDING WINDOW CASTING TRIM TRIM SHEET (SHUTTERS) COLUMN WRAP RAKE MOULDING TRIM SHEET (WALL) BEADBOARD
EXTERIORS PORTFOLIO OVERVIEW FUNCTIONAL VALUE-ADDED PRODUCTS
CORNER BOARD J-CHANNEL COLUMN WRAP
FABRICATED PRODUCTS (1)
1. AZEK does not sell fabricated products, but sells directly to the original equipment manufacturers who fabricate these products.
GATE / FENCE FLOWER BOX PERGOLA
17
▪
Primary customers include schools, parks, recreational facilities, stadium arenas, industrial plants, retail and commercial facilities
▪
Sold through both direct and indirect salesforces, covering approximately 900 dealers across North and South America
Leveraging our leading R&D capabilities and differentiated material technology to deliver innovative, low- maintenance and sustainable products to commercial and industrial customers Vertically integrated supplier of low-maintenance bathroom partitions, privacy and storage solutions Manufacturer of highly engineered plastic sheet products for diverse markets and applications
▪
Broad range of industrial end users including the marine, graphic display, recreation, outdoor living, semiconductor and chemical industries
▪
Sold to approximately 200 direct customers and distributors at locations throughout the U.S. and Canada
Sample Brands & Products
Outdoor Living Signage / Display Marine Industrial / Semiconductor
Sample Brands & Products
Partitions offering extreme privacy and innovative design Lockers engineered for strength and durability
✓ Shared material conversion objectives ✓ Common R&D platform ✓ Expands outdoor living market access
18
Full height toilet partitions
Our multi-faceted growth strategy enables us to drive above-market growth across cycles
Strong Market Growth
Leverage Investments in Sales and Marketing Organization
Grow Presence in Retail Accelerate Growth through New Products Selectively Execute Strategic Acquisitions ORGANIC GROWTH LEVERS
Long-term material conversion trend Secular growth (Outdoor Living) R&R and housing demand Large, dedicated R&D team Broad range of technologies and materials Robust new product roadmap Simplify and improve consumer experience Launch tailored new products Elevate brand awareness Expand DIY offering and Deck Resource Center Expand sales force in strategic areas of focus (i.e. Exteriors, Retail) Invest in under- penetrated markets New geographies, smaller dealers and new channels Investment in digital and consumer branding Closed three acquisitions since late 2017
19
Strategic initiatives are focused on driving significant ongoing cost benefits GM
Culture of Continuous Improvement Invested in Manufacturing Upgraded & Enabled Recycle Capability GM Contribution
+440 bps AIMS Recycle
2017 – LTM Q3 2020 Near-Term Long-Term
Continued focus on driving margin expansion Margin Improvement Future Opportunity Near-Term Expansion AIMS Recycle
ADJUSTED GROSS MARGIN EXPANSION STORY Substantial investments in people, processes and equipment over the last three years AZEK Integrated Management System (AIMS) Operating Leverage Vertically-Integrating Recycling Capabilities
20
Significant opportunity to improve our margins as we continue to leverage recent investments in recycling capabilities;
✓ New polyethylene recycling facility opened December 2018 ✓ Recently expanded capabilities within PVC recycling through Return Polymers acquisition (January 2020) ✓ Transform PE and PVC plastic waste into usable raw materials ✓ Nearly all scrap generated is recycled internally
ENABLE RECYCLING CAPABILITY
Developed initial recycle formulation Upgraded manufacturing lines STATE-OF-THE-ART RECYCLING FACILITY THREE STAGES OF RECYCLING JOURNEY
IN-HOUSE / VERTICAL INTEGRATION
Opened integrated PE recycling facility Increase mix of recycled content in our products – Currently up to 80% recycled content in capped
composite decking and ~50% recycled content in PVC decking
COST REDUCE
2020+ 2018 2019 1 2 3 Source lower cost materials Optimize formulation
HDPE LDPE
21
$476 $539 $102 $97 $579 $635 YTD Q3 2019 YTD Q3 2020 $502 $542 $655 $718 $131 $140 $139 $133 $633 $682 $794 $851 2017 2018 2019 LTM 6/30/20
Source: Company financials. Note: FY ended September. 1. Decking, Rail, and Accessories and Exteriors metrics represent net product sales growth including acquisitions of Ultralox (closed December 2017) and Versatex (closed June 2018). ($ in millions)
Residential Commercial
NET SALES AND GROWTH Strong momentum in the business leading up to COVID-19; continued strength in Residential segment in Q3
7.8% 16.5%
Exteriors (1) Total Residential DR&A (1) 7.6% 9.4% 9.1% 60.3% 7.9% 20.9% ‘15-’19 CAGR 11.2% 15.1% 12.3% Total Commercial 7.1% (0.8%) 1.4%
Growth 9.8%
(YoY Growth)
10.5%
Market Growth Conversion & Outdoor Living Growth Initiatives Long-Term Sales Growth Target
SALES GROWTH EQUATION
23
High confidence in long-term margin opportunity given high variable cost structure and modular capacity
$131 $150 $180 $200 $127 $147 20.7% 22.0% 22.6% 23.5% 22.0% 23.2% 2017 2018 2019 LTM 6/30/20 YTD Q3 2019 YTD Q3 2020
✓ Recent investments in recycling and manufacturing
productivity initiatives starting to deliver results
✓ Acquisition of Return Polymers delivered immediate
procurement cost savings
$225 $254 $315 $340 $228 $253 35.5% 37.3% 39.6% 39.9% 39.4% 39.8% 2017 2018 2019 LTM 6/30/20 YTD Q3 2019 YTD Q3 2020
ADJUSTED GROSS PROFIT AND MARGIN
($ in millions) Source: Company financials. Note: FY ended September. Refer to Appendix for reconciliations for Adjusted Gross Profit and Adjusted EBITDA.
ADJUSTED EBITDA AND MARGIN
✓ >$40 million increase in SG&A expense since 2017 ✓ Highly variable cost structure
($ in millions)
24
Source: Company financials. Note: Refer to Appendix for reconciliations for total debt, net debt and net leverage.
NET LEVERAGE SUMMARY CAPITAL ALLOCATION PRIORITIES
✓ Invest to support the business − Organic growth, operational and recycling investments ✓ Strategic M&A − Product adjacencies, new technologies / manufacturing capabilities, leverage material science expertise ✓ Debt repayment − Target operating leverage in the 2x to 3x Adj. EBITDA range
Strong cash flows and modest leverage provide flexibility to support organic growth initiatives and strategic M&A
($ in millions)
Cash and Cash Equivalents $215 Revolving Credit Facility $44 First Lien Term Loan 468 Total Debt $512 Net Debt 297 LTM 6/30/20 Adj. EBITDA $200 Total Leverage 2.6x Net Leverage 1.5x
STRATEGIC CAPACITY INVESTMENTS
25
✓ Accelerating and expanding capacity expansion plan from $100 million to $180 million across Residential segment, including a new facility in the western U.S. ✓ Multi-phase investment that is modular, flexible and supports long-term margin objectives ✓ Expected to yield ~70% incremental Decking production capacity as well as increases in Railing and Exteriors capacity over the next 18 to 24 months
A unique, long-term growth and ESG story that is well positioned to outperform in any market environment
–
Favorable long-term trends: material conversion, Outdoor Living, resilient R&R demand
–
Consumer interest in Outdoor Living products / decking has increased
–
Hold #1 or #2 position in well-structured markets
–
Broadest product portfolio serving all price points
–
Relationships with distributors, dealers and contractors built over 20+ years
–
New products – launched two new product platforms in 2020 (Reserve and Prime+)
–
Leverage investments in sales and marketing, digital and consumer branding
–
Grow presence in retail channel – new stocking positions, consumer experience, expand DIY solutions
–
Vertically integrated U.S. manufacturing network and culture of continuous improvement
–
Early innings of recycling opportunity across multiple raw material inputs
–
Reinvesting to support organic growth opportunities and strategic M&A
–
IPO meaningfully de-leveraged the balance sheet and reduced interest expense
26
Notes:
28
Twelve Months Ended, Fiscal year ending September 30
2017 2018 2019 2020 2019 2020
($ in millions, excluding EPS)
FY FY YoY % FY YoY % LTM Q3 YoY % YTD Q3 YTD Q3 YoY %
Residential $502.1 $541.9 7.9% $655.4 20.9% $717.5 14.0% $476.4 $538.5 13.0% Commercial 130.6 139.9 7.1% 138.8 (0.8%) 133.4 (5.2%) 102.2 96.8 (5.3%) Net sales $632.6 $681.8 7.8% $794.2 16.5% $850.9 10.5% $578.7 $635.3 9.8% Adjusted Gross Profit 224.5 254.1 13.2% 314.9 23.9% 339.7 14.2% 228.1 253.0 10.9% Adjusted Gross Profit Margin 35.5% 37.3% 39.6% 39.9% 39.4% 39.8% Adjusted SG&A 93.3 104.0 11.5% 135.3 30.1% 139.8 11.5% 101.1 105.5 4.4% % of Net sales 14.7% 15.3% 17.0% 16.4% 17.5% 16.6% Adjusted EBITDA $131.3 $150.1 14.3% $179.6 19.7% $199.9 16.1% $127.1 $147.4 16.0% Adjusted EBITDA Margin 20.7% 22.0% 22.6% 23.5% 22.0% 23.2% Segment Adjusted EBITDA Residential 147.3 168.4 14.3% 188.7 12.1% 218.2 19.7% 134.8 164.0 21.7% Commercial 16.1 21.7 34.2% 21.5 (0.8%) 18.0 (10.4%) 14.4 11.2 (22.2%) Adjusted Net Income $42.8 $59.2 38.3% $72.3 22.0% $48.2 $53.7 11.3% Adjusted Diluted EPS $0.40 $0.55 $0.67 $0.45 $0.47 Operating cash flow $57.4 $67.3 $94.9 $85.9 $20.3 $11.3 Capital expenditures ($22.5) ($42.8) ($63.0) ($71.3) ($46.4) ($54.8) Net leverage ratio 6.2x 7.0x 5.7x 1.5x N/M N/M Adjusted RONTA 40.6% 41.3% 44.3% N/M N/M N/M Nine Months Ended,
2020 – PVC Recycling
Acquired Return Polymers (founded 1992)
Legacy of innovation driving category leadership in Outdoor Living
2016 – 2020+
2017 – Rail
Acquired UltraLox (founded 2012)
2018 – Trim
Acquired Versatex (founded 2004)
1983 – Plastic Sheets 1990 – Bathroom Partitions 1997 – Launched Composite Decking 1999 – Launched Branded AZEK Trim 2016 – Introduced High Privacy Bathroom Partitions 2017 – Developed Multi-Year New Product Roadmap 2018 – Recycling Initiatives “Project Green” 2018 – Corporate Re-branding, New Values & Mission Rollout 2019 – TimberTech EDGE Decking, Multi-Width Decking, PaintPro Trim 2019 – Opened Chicago Training Center and HQ 2019 – Outdoor Living – TimberTech Rebrands, Digital Reset, Advertising 2020 – Launched TimberTech PRO Reserve and EDGE Prime+ Decking collections
1980 – 2009
2002 – Bathroom Partitions
Acquired Capitol and Santana Products
2007 – PVC Decking
Acquired Procell Decking Systems (founded 2004)
2012 – Launched Next- Gen Capped PVC Decking 2015 – Launch of Premium Vintage & Legacy Decking Collections 2012 – Composite Decking / Fasteners
Acquired TimberTech (founded 1997)
Internal Development – Product Launches & Key Milestones Acquisitions
New Management Team
2010 – 2015
29
ADJUSTED GROSS PROFIT RECONCILIATION ADJUSTED SG&A RECONCILIATION
Notes:
1.
Business transformation costs reflect startup costs of the Company’s new recycling facility of $2.9 million for the nine months ended June 30, 2019 and $5.3 million in fiscal 2019 and other integration-related expenses in fiscal 2017. Business transformation costs for the twelve months ended June 30, 2020 reflect startup costs of our new recycling facility of $2.4 million.
2.
Acquisition costs reflect inventory step-up adjustments related to recording the inventory of acquired businesses at fair value on the date of acquisition.
3.
Other costs includes reduction in workforce costs of $0.1 million for the nine months ended June 30, 2020. Notes:
1.
Asset impairment costs reflect tangible and intangible asset impairment costs of $1.0 million for fiscal 2017.
2.
Business transformation costs reflect consulting costs related to repositioning of brands of $0.0 million and $3.9 million for the nine months ended June 30, 2020 and 2019, respectively, and $4.3 million, $0.0 million and $2.0 million in fiscal 2019, 2018 and 2017, respectively, compensation costs related to the transformation of the senior management team of $0.4 million and $1.9 million for the nine months ended June 30, 2020 and 2019, respectively, and $2.3 million, $0.2 million and $4.3 million in fiscal 2019, 2018 and 2017, respectively, costs related to the relocation of corporate headquarters of $0.0 million and $1.8 million for the nine months ended June 30, 2020 and 2019, respectively, and $2.0 million in fiscal 2019, and other integration-related costs of $0.0 million and $2.1 million for the nine months ended June 30, 2020 and 2019, respectively, and $2.7 million, $5.6 million and $0.7million in fiscal 2019, 2018 and 2017, respectively. Business transformation costs for the twelve months ended June 30, 2020 reflect repositioning
costs related to the relocation of our corporate headquarters of $0.2 million, and other integration-related costs of $0.7 million.
3.
Capital structure transaction costs reflect non-capitalizable debt and equity issuance costs.
4.
Acquisition costs reflect costs directly related to completed acquisitions of $0.9 million and $3.7 million for the nine months ended June 30, 2020 and 2019, respectively, and $4.1 million and $1.0 million in fiscal 2019 and 2018, respectively.. Acquisition costs for the twelve months ended June 30, 2020 reflect costs directly related to completed acquisitions of $1.3 million.
5.
Other costs reflect costs for legal defense of $0.4 million and $0.8 million for the nine months ended June 30, 2020 and 2019, respectively, and $0.9 million, $1.5 million and $5.2 million in fiscal 2019, 2018 and 2017, respectively, insurance reimbursement of ($7.7) million in the nine months ended June 30, 2019, and in fiscal 2019, settlement costs of $0.0 million and $15.0 million in fiscal 2018 and 2017, respectively, costs related to an incentive plan associated with AZEK’s IPO of $2.2 million and $0.2 million for the nine months ended June 30, 2020 and 2019, respectively, and other miscellaneous adjustments of $0.0 million, $0.2 million and $0.1 million in fiscal 2019, 2018 and 2017, respectively. Other costs for the twelve months ended June 30, 2020 reflect costs related to an incentive plan associated with our IPO of $2.0 million, costs for legal expenses of $0.5 million and reduction in workforce costs of $0.3 million.
Source: Company financials. Numbers may not sum due to rounding.
30
Twelve Months Ended, Nine Months Ended, Fiscal year ending September 30 2017 2018 2019 2020 2019 2020 ($ in millions) FY FY FY LTM Q3 YTD Q3 YTD Q3 Gross Profit $169.0 $202.0 $253.2 $275.3 $183.7 $205.8 Depreciation 27.2 23.0 28.9 36.0 20.8 27.9 Amortization 26.7 26.6 27.5 25.4 20.7 18.6 Business transformation costs(1) 1.6
2.4 2.9
Other cost(3)
Adjusted Gross Profit $224.5 $254.1 $314.9 $339.7 $228.1 $253.0 Adjusted Gross Profit Margin 35.5% 37.3% 39.6% 39.9% 39.4% 39.8% Twelve Months Ended, Fiscal year ending September 30 2017 2018 2019 2020 2019 2020 ($ in millions) FY FY FY LTM Q3 YTD Q3 YTD Q3 SG&A $147.0 $144.7 $183.6 $204.9 $137.0 $158.3 Depreciation 2.8 3.3 4.8 7.2 3.3 5.7 Amortization 20.9 24.8 32.8 31.0 24.8 23.0 Share-based compensation costs 1.5 3.1 3.7 21.3 2.6 20.2 Asset impairment costs(1) 1.0 0.1
7.0 5.8 11.3 2.0 9.7 0.4 Capital structure transaction costs(3) 0.3 0.4
Acquisition costs(4)
4.1 1.3 3.7 0.9 Non-recurring IPO profits interest conversion costs
20.3 1.7 (6.8) 2.8 (6.7) 2.9 Loss on disposal of PP&E
(0.4) (1.5) (0.4) Adjusted SG&A $93.3 $104.0 $135.3 $139.8 $101.1 $105.5 Nine Months Ended,
ADJUSTED EBITDA RECONCILIATION
Notes:
1.
Asset impairment costs reflect tangible and intangible asset impairment costs of $0.9 million and $48.8 million for fiscal 2018 and 2017, respectively. The tangible asset impairment costs for fiscal 2017 include the write off of $1.1 million of inventory relating to certain products determined not to be commercially viable.
2.
Business transformation costs reflect consulting costs related to repositioning of brands of $0.0 million and $3.9 million for the nine months ended June 30, 2020 and 2019, respectively, and $4.3 million, $0.0 million and $2.0 million in fiscal 2019, 2018 and 2017, respectively, compensation costs related to the transformation of the senior management team of $0.4 million and $1.9 million for the nine months ended June 30, 2020 and 2019, respectively, and $2.3 million, $0.2 million and $4.3 million in fiscal 2019, 2018 and 2017, respectively, costs related to the relocation of corporate headquarters of $0.0 million and $1.8 million for the nine months ended June 30, 2020 and 2019, respectively, and $2.0 million in fiscal 2019, startup costs of the Company’s new recycling facility of $0.0 million and $2.9 million for the nine months ended June 30, 2020 and 2019, respectively, and $5.3 million in fiscal 2019, and
$2.7 million, $5.6 million and $2.3 million in fiscal 2019, 2018 and 2017, respectively. Business transformation costs for the twelve months ended June 30, 2020 reflect repositioning of our brands of $0.3 million, compensation costs related to the transformation
startup costs of our new recycling facility of $2.4 million and other integration-related costs of $0.7 million.
3.
Capital structure transaction costs reflect non-capitalizable debt and equity issuance costs.
4.
Acquisition costs reflect costs directly related to completed acquisitions of $0.9 million and $3.7 million for the nine months ended June 30, 2020 and 2019, respectively, and $4.1 million and $4.9 million in fiscal 2019 and 2018, respectively, and inventory step-up adjustments related to recording the inventory of acquired businesses at fair value on the date of acquisition of $0.6 million and $0.0 million for the nine months ended June 30, 2020 and 2019, respectively, and $2.4 million in fiscal 2018. Acquisition costs for the twelve months ended June 30, 2020 reflect costs directly related to completed acquisitions of $1.3 million and inventory step- up adjustments related to recording the inventory of acquired businesses at fair value on the date of acquisition of $0.7 million.
5.
Other costs reflect costs for legal defense of $0.4 million and $0.8 million for the nine months ended June 30, 2020 and 2019, respectively, and $0.9 million, $1.5 million and $5.2 million in fiscal 2019, 2018 and 2017, respectively, insurance reimbursement of ($7.7) million in the nine months ended June 30, 2019, and in fiscal 2019, settlement costs of $0.0 million and $15.0 million in fiscal 2018 and 2017, respectively, costs related to an incentive plan associated with AZEK’s IPO of $2.2 million and $0.2 million for the nine months ended June 30, 2020 and 2019, respectively, and other miscellaneous adjustments of $0.0 million, $0.2 million and $0.1 million in fiscal 2019, 2018 and 2017, respectively. Other costs for the twelve months ended June 30, 2020 reflect costs related to an incentive plan associated with our IPO of $2.0 million, costs for legal expenses of $0.5 million and reduction in workforce costs of $0.4 million.
Source: Company financials. Numbers may not sum due to rounding.
ADJUSTED RONTA RECONCILIATION
31
Note: Adjusted RONTA is calculated as Adj. EBITA / Net Tangible Assets, where Net Tangible Assets are calculated as Trade Receivables, net + Inventories + PP&E, net – Accounts Payable Twelve Months Ended, Fiscal year ending September 30
2017 2018 2019 ($ in millions) FY FY FY Adjusted EBITDA $131.3 $150.1 $179.6 Less: Depreciation (30.0) (26.3) (33.7) Adjusted EBITA $101.2 $123.8 $145.9 Net tangible assets Plus: Trade receivables, net 41.4 44.0 52.6 Plus: Inventories 98.9 110.9 115.4 Plus: PP&E, net 134.6 180.8 208.7 Less: Accounts payable (25.8) (35.9) (47.5) Net tangible assets $249.0 $299.8 $329.2 Adjusted RONTA 40.6% 41.3% 44.3%
NET DEBT RECONCILIATION
($ in millions) LTM 6/30/2020 Long-term debt - less current portion $506.7 Plus: Unamortized deferred financing fees 4.5 Plus: Unamortized original issue discount 0.5 Total Debt $511.7 Less: Cash and cash equivalents (215.1) Net Debt $296.5
$199.9 7 Total Leverage 2.6x Net Leverage 1.5x Twelve Months Ended, Fiscal year ending September 30 2017 2018 2019 2020 2019 2020 ($ in millions) FY FY FY LTM Q3 YTD Q3 YTD Q3 Net Income (Loss) ($67.4) $6.7 ($20.2) ($58.8) ($19.3) ($57.9) Interest expense 61.6 68.7 83.2 84.9 63.2 64.9 Depreciation 30.0 26.3 33.7 43.2 24.2 33.6 Amortization 47.6 51.4 60.2 56.4 45.5 41.6 Tax (benefit)/expense (20.0) (23.1) (4.0) (3.3) (4.8) (4.2) Share-based compensation costs 1.5 3.1 3.7 21.3 2.6 20.2 Asset impairment costs(1) 48.8 0.9
8.6 5.8 16.6 4.4 12.6 0.4 Capital structure transaction costs(3) 0.3 0.4
Acquisition costs(4)
4.1 2.0 3.7 1.5 Non-recurring initial public offering costs
9.1 9.6 6.2 6.7 Other costs(5) 20.3 1.7 (6.8) 2.9 (6.7) 3.0 Adjusted EBITDA $131.3 $150.1 $179.6 $199.9 $127.1 $147.4 Adjusted EBITDA Margin 20.7% 22.0% 22.6% 23.5% 22.0% 23.2% Nine Months Ended,
ADJUSTED NET INCOME RECONCILIATION
Notes:
1.
Asset impairment costs reflect tangible and intangible asset impairment costs of $0.9 million and $48.8 million in fiscal 2018 and
products determined not to be commercially viable.
2.
Business transformation costs reflect consulting costs related to repositioning of our brands of $0.0 million and $3.9 million for the nine months ended June 30, 2020 and 2019, respectively, and $4.3 million, $0.0 million and $2.0 million in fiscal 2019, 2018 and 2017, respectively, compensation costs related to the transformation of the senior management team of $0.4 million and $1.9 million for the nine months ended June 30, 2020 and 2019, respectively, and $2.3 million, $0.2 million and $4.3 million in fiscal 2019, 2018 and 2017, respectively, costs related to the relocation of our corporate headquarters of $0.0 million and $1.8 million for the nine months ended June 30, 2020 and 2019, respectively, and $2.0 million in fiscal 2019, startup costs of our new recycling facility of $0.0 million and $2.9 million for the nine months ended June 30, 2020 and 2019, respectively, and $5.3 million in fiscal 2019, and other integration-related costs of $0.0 million and $2.1 million for the nine months ended June 30, 2020 and 2019, respectively, and $2.7 million, $5.6 million and $2.3 million in fiscal 2019, 2018 and 2017, respectively.
3.
Capital structure transaction costs reflect non-capitalizable debt and equity issuance costs.
4.
Acquisition costs reflect costs directly related to completed acquisitions of $0.9 million and $3.7 million for the nine months ended June 30, 2020 and 2019, respectively, and $4.1 million and $4.9 million in fiscal 2019 and 2018, respectively, and inventory step-up adjustments related to recording the inventory of acquired businesses at fair value on the date of acquisition of $0.6 million and $0.0 million for the nine months ended June 30, 2020 and 2019, respectively, and $2.4 million in fiscal 2018.
5.
Other costs reflect costs for legal defense of $0.4 million and $0.8 million for the nine months ended June 30, 2020 and 2019, respectively, and $0.9 million, $1.5 million and $5.2 million in fiscal 2019, 2018 and 2017, respectively, insurance reimbursement of ($7.7) million in the nine months ended June 30, 2019, and in fiscal 2019, settlement costs of $0.0 million and $15.0 million in fiscal 2018 and 2017, respectively, and other miscellaneous adjustments of $0.0 million, $0.2 million and $0.1 million in fiscal 2019, 2018 and 2017, respectively.
6.
Tax impact of adjustments is based on applying a combined U.S. federal and state statutory tax rate of 24.5%, 24%, 24% and 38% for fiscal 2020, 2019, 2018 and 2017, respectively, except that a tax rate of 0% was applied to the adjustments for share-based compensation costs and for goodwill impairment in fiscal 2017 as those items did not give rise to income tax deductions.
7.
Tax Act remeasurement is a one-time tax benefit of $22.5 million as a result of the remeasurement of certain deferred taxes due to the enactment of the Tax Act.
8.
Weighted average common shares outstanding used in computing diluted net income (loss) per common share is 113,635,347 shares for the nine months ended June 30, 2020, and 108,162,741 shares for the nine months ended June 30, 2019, and for fiscal years 2019, 2018 and 2017.
Source: Company financials. Numbers may not sum due to rounding.
32
ADJUSTED DILUTED EPS RECONCILIATION
Twelve Months Ended, Nine Months Ended, Fiscal year ending September 30 2017 2018 2019 2019 2020 ($ in millions) FY FY FY YTD Q3 YTD Q3 Net Income (Loss) ($67.4) $6.7 ($20.2) ($19.3) ($57.9) Depreciation 30.0 26.3 33.7 24.2 33.6 Amortization 47.6 51.4 60.2 45.5 41.6 Share-based compensation costs 1.5 3.1 3.7 2.6 20.2 Asset impairment costs(1) 48.8 0.9
8.6 5.8 16.6 12.6 0.4 Capital structure transaction costs(3) 0.3 0.4
Acquisition costs(4)
4.1 3.7 1.5 Non-recurring initial public offering costs
9.1 6.2 6.7 Other costs(5) 20.3 1.7 (6.8) (6.7) 3.0 Tax impact of adjustments(6) (46.9) (22.7) (28.0) (20.5) (33.1) Tax Act remeasurement(7)
$42.8 $59.2 $72.3 $48.2 $53.7 Twelve Months Ended, Nine Months Ended, Fiscal year ending September 30 2017 2018 2019 2019 2020 FY FY FY YTD Q3 YTD Q3 Net Income (Loss) per common share - diluted ($0.62) $0.06 ($0.19) ($0.18) ($0.51) Depreciation 0.28 0.24 0.31 0.22 0.30 Amortization 0.44 0.47 0.56 0.42 0.37 Share-based compensation costs 0.01 0.03 0.04 0.03 0.18 Asset impairment costs(1) 0.45 0.01
0.08 0.05 0.15 0.12 0.00 Capital structure transaction costs(3) 0.00 0.00
Acquisition costs(4)
0.04 0.03 0.01 Non-recurring initial public offering costs
0.08 0.06 0.06 Other costs(5) 0.19 0.02 (0.06) (0.06) 0.03 Tax impact of adjustments(6) (0.43) (0.21) (0.26) (0.19) (0.29) Tax Act remeasurement(7)
$0.40 $0.55 $0.67 $0.45 $0.47