
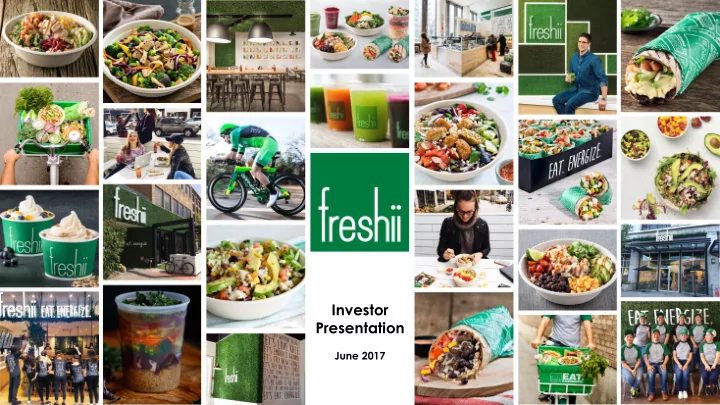
SLIDE 1
Investor Presentation
June 2017
Investor Presentation June 2017 DISCLAIMERS Forward-Loo Lookin - - PowerPoint PPT Presentation
Investor Presentation June 2017 DISCLAIMERS Forward-Loo Lookin ing Infor orma mati tion on This Presentation contains forward -looking information for purposes of applicable securities laws (forward -looking statements), which
Investor Presentation
June 2017
DISCLAIMERS
1
Forward-Loo Lookin ing Infor
mati tion
This Presentation contains “forward-looking information” for purposes of applicable securities laws (“forward-looking statements”), which reflect the current view of management with respect to the Company's objectives, plans, goals, strategies, outlook, results of
expressions identify forward-looking information and forward-looking statements. Forward-looking information and forward-looking statements should not be read as guarantees of future events, performance or results, and will not necessarily be accurate indications of whether, or the times at which, such events, performance or results will be achieved. All of the information in this Presentation containing forward-looking information or forward-looking statements is qualified by these cautionary statements. Forward-looking information and forward-looking statements are based on information available to management at the time they are made, underlying estimates, opinions and assumptions made by management and management's current good faith belief with respect to future strategies, prospects, events, performance and results, and are subject to inherent risks and uncertainties surrounding future expectations generally. Such risks and uncertainties include, but are not limited to, those described in “Risk Factors” which are described in the Company’s annual information form dated March 22, 2017 filed on www.sedar.com. Readers are urged to consider the risks, uncertainties and assumptions carefully in evaluating the forward-looking information and forward-looking statements and are cautioned not to place undue reliance on such information and statements. The Company does not undertake to update any such forward-looking information or forward-looking statements, whether as a result of new information, future events or otherwise, except as required by applicable laws. Non-IFRS Measu sures and Industry stry Metrics cs This Presentation makes reference to certain non-IFRS measures including key performance indicators used by management and typically used by our competitors in the restaurant industry. These measures are not recognized measures under IFRS and do not have a standardized meaning prescribed by IFRS and are therefore unlikely to be comparable to similar measures presented by other companies. Rather, these measures are provided as additional information to complement those IFRS measures by providing further understanding
EBITDA”, “Pro Forma Adjusted EBITDA”, “free cash flow”, “free cash flow conversion”, “Adjusted Net Income” and “Pro Forma Adjusted Net Income”. This Presentation also makes reference to “system-wide sales” and “same-store sales growth” which are commonly used
and liquidity and thus highlight trends in our business that may not otherwise be apparent when relying solely on IFRS measures. We also believe that securities analysts, investors and other interested parties frequently use non-IFRS measures, including restaurant industry metrics, in the evaluation of companies in the restaurant industry. The Company's management also uses non-IFRS measures and restaurant industry metrics in order to facilitate operating performance comparisons from period to period, to prepare annual operating budgets and forecasts and to determine components of management compensation. For a: (i) detailed definition of each of the non-IFRS measures and industry metrics referred to; and (ii) reconciliation of these non-IFRS measures refer to the Company's Management’s Discussion and Analysis dated March 22, 2017, which is available on SEDAR at www.sedar.com. Fina nancia cial Matt tters In this Presentation, all amounts are in U.S. dollars, unless otherwise indicated. Any graphs, tables or other information in this Presentation demonstrating the historical performance of the Company or any other entity contained in this Presentation are intended only to illustrate past performance of such entities and are not necessarily indicative of future performance of the Company or such entities. Any financial outlook or future oriented financial information in this Presentation, has been approved by management of the Company as of May 4, 2017. Such financial outlook or future oriented financial information is provided for the purpose of providing information about management's current expectations and plans relating to the future. Readers are cautioned that reliance on such information may not be appropriate for other purposes. Industry stry and Market Data ta Market data and industry forecasts contained in this Presentation have been obtained from industry publications, various publicly available sources and reports purchased by the Company as well as from management’s good faith estimates, which are derived from management’s knowledge of the industry and independent sources that management believes to be reliable. Industry publications, surveys and forecasts generally state that the information contained therein has been obtained from sources believed to be reliable. We have not independently verified any of the information from third-party sources nor have we ascertained the validity or accuracy of the underlying economic assumptions relied upon therein. Certain of the industry data presented herein has been derived from reports commissioned and paid for by the Company and prepared by Technomic Inc., a research and consulting firm servicing the food and food service industry, in 2016. Actual outcomes may vary materially from those forecast in the reports or publications referred to herein, and the prospect for material variation can be expected to increase as the length of the forecast period increases. Although we believe these sources are generally reliable, the accuracy and completeness of such information is not guaranteed and has not been independently verified.
global health and wellness movement, pioneering the new “healthy fast food” category
millennial generation
chain restaurant in the world for 2015 (by store growth)1
same-store sales growth
approximately 99% franchised
2
OUR MISSION To help citizens
live better by making healthy food convenient and affordable
1 In Technomic’s “2016 Technomic Top 100 Global Chain Restaurant Report”.CONFIDENTIAL
HEAL HEALTH TH & & WELLNE WELLNESS SS MILLENNI MILLENNIALS ALS AFFOR AFFORDAB ABLE LE ENT ENTREPRENE REPRENEURSHIP URSHIP
3
CONFIDENTIAL
INVESTMENT HIGHLIGHTS
4
Leading North American Fast Casual Restaurant Operator with a Unique and Powerful Brand Innovative and Evolving Menu of Healthy, Fresh and Craveable Food at Affordable Price Points Asset-Light Franchise Model with an Exceptional New Store Growth Opportunity Compelling Unit Economics Driven by Flexible Real Estate Model Strong Franchise Partner Network and New Store Pipeline Strong Financial Performance with Track Record of Best- in-Class Free Cash Flow Conversion Innovative and Founder-Led Corporate Team with a Proven Track Record of Success
1. 2. 3. 4. 5. 6. 7.
CONFIDENTIAL
70
SYSTEM-WIDE STORES
2013 2014 2015 2016 101 178 278
YEARS TO REACH 200 STORES1
11 McDonald’s Subway Domino’s Pizza 12 16 18
5
LEADING NORTH AMERICAN FAST CASUAL RESTAURANT OPERATOR WITH A UNIQUE AND POWERFUL BRAND
from 70 locations to 301 locations as of March 26th, 2017, while concurrently delivering 16 consecutive quarters of positive same-store sales growth
Report”, Freshii was ranked the fastest growing multinational chain restaurant in the world for 2015 (by store growth)
support our future growth
CONFIDENTIAL
1 The information relating to the number of years these competitors took to reach 200 stores was obtained from the official website of each respective party or from other publicly available sources which we believe are accurate and reliable. 6
growth
bowls, burritos, wraps, soups, juices, smoothies and frozen yogurt, which gives us broad customer appeal and helps us avoid the “veto vote”
around health at an average entrée price of US$7.50 and evolves frequently with trends, similar to how a ‘fast fashion’ retailer evolves
Bowls 30% Beverages, Frozen Yogurt, Pressed Juices, Retail 21% Salads 12% Burritos 10% Wraps 6% Soups 3% Catering 2% Breakfast 2% Toppings 14%
MENU CATEGORIES1 (% OF SALES)
CONFIDENTIAL
1 Financial information for fiscal 2016, for traditional franchised locations in North America. OPPORTUNITIES TO EXPAND AND OPTIMIZE MENU MIX AND DAYPARTS
BREAKFAST (OPEN – 10:30AM) 6% LUNCH (10:30AM – 2:30PM) 61% SNACK (2:30PM – 5:00PM) 15% DINNER (5:00PM – CLOSE) 18%
MEAL BOX
meals and two snacks each day
store and delivered daily to customers’ preferred location JUICE CLEANSES
CATERING AND SNACKS
shareable snacks, platters, wraps and burrito boxes and salads to large groups
increase the average in-store purchase BREAKFAST
with the introduction of Protein Egg Bowls and Green Smoothie Bowls
DAYPART1 (% OF SALES)
7
1 Financial information for fiscal 2016, for traditional franchised locations in North America.CONFIDENTIAL
8
to greater than 2,500 square feet in urban business districts, suburban settings, university campuses and retail stores
build-out costs and generate attractive cash-on-cash returns1
ILLUSTRATIVE NEW STORE TARGET CASH BUILD-OUT COST2 No Expensiv pensive e Kitche chen Equipme ment nt
No Oven n No Grill ll No Vents ts No Fryers No Hoods No Freezers No Micro crowa waves
$26 260K
Target et Cash Build-Out t Cost2 (Nor
th Americ rica)
Location
y Village Toronto,
Square are Footage: 425 Build-Out t Cost: : C$245,790 Location
Winnipeg, MB, Canada Square are Footage: 1,033 Build-Out t Cost: : C$293,000 Location
y Road Columbus, s, OH, USA Square are Footage: 1,200 Build-Out t Cost: : $234,000 Location
son Fort Wayne, IN, USA Square are Footage: 1,862 Build-Out t Cost: : $254,000
ATTRACTIVE NEW UNIT ECONOMICS (NORTH AMERICAN TRADITIONAL STORES ONLY)
Target Cash Build-Out Cost2 (incl. franchise fee3) $260,000 Sales-to-Investment Ratio4 Greater than 2.0x Cash-on-Cash Returns1 In Excess of 40%
Illust stra rative Return rn on Invest estment: nt:
2 “Target Cash Build-Out Costs” means the estimated target investment costs for new stores across North America, including, but not limited to, initial franchise fees, kitchen equipment and small-ware, leasehold and construction costs, furniture, signage, menu boards, point of sale equipment, other technology equipment, architectural costs and other miscellaneous costs, and excluding pre-opening expenses, lease costs and working capital, in each case payable in the local currency and based in part on estimates derived from information reported to us by our franchise partners. 3 In local currency. 4 “Sales-to-Investment ratio” means year two AUV divided by the target cash build-out costs of approximately $260,000 (in local currency). 1 “Cash-on-Cash Returns” means estimated year two store level operating profit after royalties and advertising, but before the impact of store owner operator or manager salaries, divided by the target cash build-out costs of approximately $260,000 (in local currency).CONFIDENTIAL
which is anticipated to allow us to generate strong and consistent free cash flow while concurrently experiencing rapid new store growth
franchised as of March 26th, 2017
these new stores without a material increase in Freshii’s overhead expenses and capital expenditures
2014 101
EXCEPTIONAL NEW STORE GROWTH
2015 2016 278 +208 units 58.4% CAGR
9
CONFIDENTIAL 178 70 2013
awarded franchises to fewer than 1.7% of applicants
traditional franchise partner
stores as of March 26th, 2017
brokerage team, who will work with new franchise partners to identify and select real estate from a preferred list of pre-identified locations in target markets
STRONG FRANCHISE PARTNER NETWORK AND NEW STORE PIPELINE
ILLUSTRATIVE TIMELINE (APPROXIMATELY 11 MONTHS FROM APPLICATION TO OPENING)
10
CONFIDENTIAL
Drive Same-Store Sales Growth Rapidly Grow Our Franchise Partner Store Base Enhance Profitability and Free Cash Flow
GROWTH DRIVERS
11
CONFIDENTIAL
applications from new franchise partners and the significant demand for new locations from our existing franchise partners
net new franchised stores in 2017 to reach approximately 430 to 440 system-wide stores by the end of fiscal 2017
end of fiscal 2019
SYSTEM-WIDE STORE COUNT CURRENT GLOBAL FRANCHISE NETWORK1
2019E 810 to 840
+632 TO 662 STORES +46.7% CAGR2
2017E 430 to 440 2016 278 2015 178
1 Includes recently executed master franchise agreements. As of March 26th, 2017. 2 Based on midpoint of 825 stores in 2019E.12
CONFIDENTIAL
Impressive Global Non-Traditional Partners
We believe these non-traditional partnerships will help us to further
STRATEGIC PARTNERSHIPS AND LICENSING AGREEMENTS NON–TRADITIONAL FRANCHISE PARTNERSHIPS PILOT PROGRAM – HIGH SCHOOL LUNCHES September 2016: Freshii launched a pilot meal delivery program with a high school in Toronto, Canada to energize an even younger generation
Services Group
54 STORES AS OF Q1 2017
Universities Airports Hospitals Fitness Centres Select Retailers (including Walgreens and Target)
in Los Angeles, Minneapolis, Miami & Chicago
CONFIDENTIAL
13
We intend to continue to drive same-store sales growth through the following strategies:
Attra ract ct New ew Custome mers rs by Expandin anding Brand and Aware rene ness
expand our brand reach and drive traffic to our stores
Incre rease ase Frequen equency cy of Custome mer r Visits its and d Traf affi fic c Thro roug ugh h Menu enu Innovat atio ion
and perfect menu items that appeal to our customers’ evolving tastes
kitchens and strong relationships with suppliers
Expand and and d Optimi mize Menu enu Mix and d Day aypar arts
cleanses, catering services, snacks and enhanced breakfast offerings
Levera rage Mobil ile Tech chno nology to Incre rease ase Orde der r Frequen equency cy and d Spee eed of Serv rvice ce
and brand loyalty
(3.5%) 2.4% 0.9% 2.0% 0.6% 2.8% 6.8% 10.0% 12.1% 8.2% 7.6% 2.5% 3.3% 6.5% 4.8% 7.3% 7.0% 5.3% 6.8%
SAME STORE SALES GROWTH
2013 2014 2015 2016
14
Q1 Q2 Q3 Q4 2013 Q1 Q2 Q3 Q4 2014 Q1 Q2 Q3 Q4 2015 Q1 Q2 Q3 Q4 CONFIDENTIAL
GENERATED 16 CONSECUTIVE FISCAL QUARTERS OF POSITIVE SAME-STORE SALES GROWTH, INCLUDING SAME-STORE SALES GROWTH OF 6.4% FOR Q1 2017
2016 7.7% 2017 Q1 6.4%
Our franchised business model is asset-light and requires minimal capital expenditures by Freshii, which is anticipated to allow us to generate strong and consistent free cash flow while concurrently experiencing rapid new store growth
TOTAL REVENUE (US$ MILLIONS)
$7.7
SYSTEM-WIDE SALES (US$ MILLIONS)
$9.0 $11.1 $16.1 $1.9/C$1.94
PRO FORMA ADJUSTED EBITDA1,2 (MILLIONS)
$3.0/C$3.34 $4.7/C$6.04 $7.3/C$9.64 93.1%
FREE CASH FLOW CONVERSION5
76.1% 89.4% 95.6%
1 “Adjusted EBITDA” means EBITDA adjusted for share-based compensation, a contract termination fee, service provider commission costs, a legal settlement, other expenses and costs in connection with the Offering and Reorganization. “Pro Forma Adjusted EBITDA” means Adjusted EBITDA adjusted for commission costs paid under the Chicago master franchise agreement for which the Company intends to use a portion of the net proceeds from the Treasury Offering to exercise its buyback provision. 2 The bar chart represents US$ Pro Forma Adjusted EBITDA and is not to scale with C$ Pro Forma Adjusted EBITDA. 3 Calculated based on US$ Pro Forma Adjusted EBITDA. 4 Represents the Canadian dollar Pro Forma Adjusted EBITDA converted at the average exchange rates for each respective period. 5 “Free Cash Flow Conversion” means Pro Forma Adjusted EBITDA less capital expenditures divided by Pro Forma Adjusted EBITDA.PRO FORMA ADJUSTED EBITDA1 MARGIN
24.4% 33.7% 42.6% 45.1%
AVERAGE FCF CONVERSION (2013 TO 2016)
88.6% 2013 2014 2015 2016 2013 2014 2015 2016 2013 2014 2015 2016
CONFIDENTIAL
15
$29.1 $41.7 $61.3 $96.1 2013 2014 2015 2016
We are committed to rapidly increasing the number of franchise locations in our store network and leveraging the scalability of our operating platform to increase the profitability of our business
KEY METRICS (US$) FISCAL 2017 OUTLOOK FISCAL 2019 OUTLOOK
System em-Wide de Store re Coun unt 430 430 to 440 total stores es 810 to 840 total stores es Annua ual Same-Store Store Sales Growth wth 3.0% % to 4.0%2 System em-Wide de Sales es
5 to $365 5 million
Avera rage e Royalty y Rate 6.0% % to 7.0%2 Avera rage e Franchi hise se Fees es $30,000 ,000 per store3 Other er Income me 2.5% % of system em-wi wide de sales2 SG&A &A 4.0% % to 5.0% % of system-wi wide de sales2 Pro Forma ma Adjust usted ed EBITDA4
16
1 Outlook Summary as of May 4, 2017. 2 For the period fiscal 2017 through fiscal 2019. 3 In local currency (except for international franchise partners, who are required to pay this amount in US$). 4 “Adjusted EBITDA” means EBITDA adjusted for share-based compensation, a contract termination fee, service provider commission costs, a legal settlement, other expenses and costs in connection with the Offering and Reorganization. “Pro Forma Adjusted EBITDA” means Adjusted EBITDA adjusted for commission costs paid under the Chicago master franchise agreement for which the Company intends to use a portion of the net proceeds from the Treasury Offering to exercise its buyback provision.CONFIDENTIAL
1