SLIDE 23 23
45
Investor Day 2016
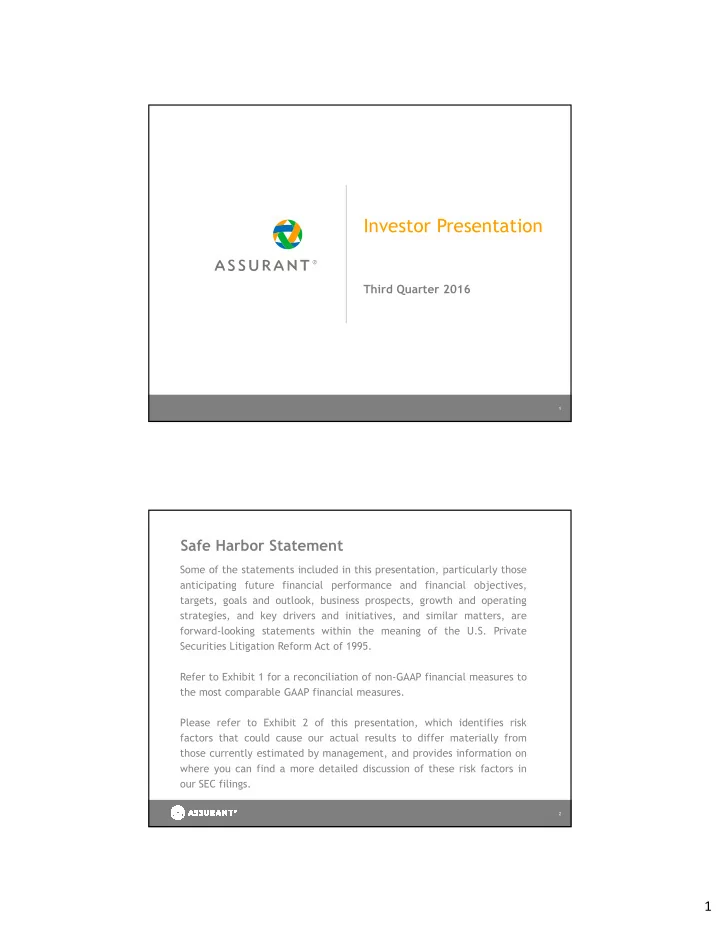
Diversified Investment Portfolio
Summary Statistics – 6/30/14
Unrealized Gain on Fixed Maturities (billions) $1.2 Market Value (billions) $16.1 Average Duration (years) 6.5 Investment Yield 4.4% Average Quality A2
Summary Statistics –9/30/16
Market Value (billions) $13.1 Investment Yield Year- to-Date 9/30/16(2) 3.97% Unrealized Gain on Fixed Maturities (billions) $1.1 Average Duration(3) (years) 6.81 Average Quality A2 Investment Portfolio Breakdown(1) 9/30/16 Fixed Maturity Securities by Credit Quality 9/30/16
Note: Investment Portfolio Information includes Assurant Health Runoff Operations and excludes the divested Assurant Employee Benefits business, which was sold on March 1, 2016. (1) Expressed as a percentage of total investments & cash and cash equivalents of $13.1 billion as of 9/30/16. (2) Investment yield excludes investment (loss) income from real estate joint venture partnerships. (3) Average duration excludes policy loans, securities lending, and other investments and includes cash and cash equivalents held at Corporate.
RMBS CMBS ABS 8% Municipals 4% Foreign Govt 5% U.S. Govt/Agency 1% Cash and Cash Equivalents 8% Short-term 3% Commercial Mortgages 5% Other 5% Preferred Stocks 3% Aaa / Aa / A 62% Baa 31% Ba 5%
B and lower 2%
Corporate 58%
46
Investor Day 2016
1. Assurant uses operating return on equity ("Operating ROE"), excluding accumulated other comprehensive income ("AOCI"), as an important measure of the company’s operating performance. Operating ROE, excluding AOCI, equals net operating income (defined below) for the periods presented divided by average stockholders’ equity, excluding AOCI, for the year to date period. The company believes operating ROE provides investors a valuable measure of the performance of the company’s ongoing business, because it excludes the effect of Assurant Health runoff operations and the divested Assurant Employee Benefits business, which was sold on March 1, 2016. The calculation also excludes net realized gains (losses) on investments, amortization of deferred gains and gains on disposal of businesses and those events that are highly variable and do not represent the ongoing operations of the company. The comparable GAAP measure would be GAAP return on equity (“GAAP ROE”), defined as net income, for the periods presented, divided by average stockholders’ equity for the year to date period.
Exhibit 1: Non-GAAP Financial Measures
Assurant uses the following non-GAAP financial measures to analyze the company’s operating performance for the periods presented in this news
- release. Because Assurant’s calculation of these measures may differ from similar measures used by other companies, investors should be careful when
comparing Assurant’s non-GAAP financial measures to those of other companies. Note: Additional financial information, including a schedule of disclosed items that affected Assurant’s results by business appears on the Company’s Financial Supplement, and is located in the Investor Relations section of www.assurant.com.
9 Months 12 Months 2016 2015 Annual operating return on average equity, excluding AOCI
9.2% 11.5%
Assurant Health runoff operations
(1.3)% (10.6)%
Assurant Employee Benefits
0.4% 1.4%
Net realized gains on investments
4.6% 0.6%
Amortization of deferred gains and gains on disposal of businesses
7.4% 0.2%
Other adjustments: Gain on divested business
Change in tax liabilities
Payment received related to previous sale of subsidiary
Gain related to benefit plan activity
0.6%
- Amount related to the sale of AEB
(0.6)%
- Post-close cont. liab. on previous disposition
(0.4)%
- Intangible asset impairment
(0.4)%
- Change in derivative investment
0.1% (0.1)%
Change due to effect of including AOCI
(3.8)% (1.2)%
Annual GAAP return on average equity
15.8% 2.9%