
SLIDE 1
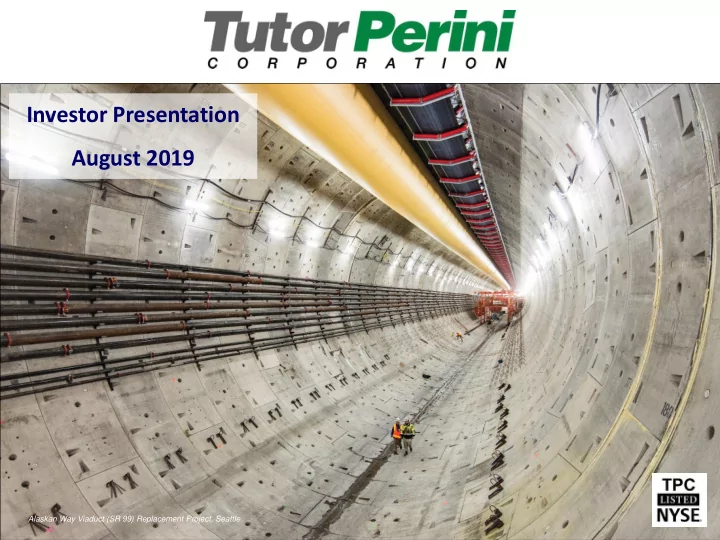
Investor Presentation August 2019
Alaskan Way Viaduct (SR 99) Replacement Project, Seattle
Investor Presentation August 2019 Alaskan Way Viaduct (SR 99) - - PowerPoint PPT Presentation
Investor Presentation August 2019 Alaskan Way Viaduct (SR 99) Replacement Project, Seattle Forward-Looking Statements Statements contained in this presentation that are not purely historical are forward-looking statements within the meaning of
Alaskan Way Viaduct (SR 99) Replacement Project, Seattle
Statements contained in this presentation that are not purely historical are forward-looking statements within the meaning of the Private Securities Litigation Reform Act of 1995, including without limitation, statements regarding the Company’s expectations, hopes, beliefs, intentions or strategies regarding the future and statements regarding future guidance or estimates and non-historical performance. These forward-looking statements are based on the Company’s current expectations and beliefs concerning future developments and their potential effects on the Company. While the Company’s expectations, beliefs and projections are expressed in good faith and the Company believes there is a reasonable basis for them, there can be no assurance that future developments affecting the Company will be those that we have anticipated. These forward-looking statements involve a number of risks, uncertainties (some of which are beyond the control of the Company) or other assumptions that may cause actual results or performance to be materially different from those expressed or implied by such forward-looking statements. These risks and uncertainties include, but are not limited to: revisions of estimates of contract risks, revenue or costs, the timing of new awards or the pace of project execution, which may result in losses or lower than anticipated profit; unfavorable outcomes of existing or future litigation or dispute resolution proceedings against clients (project owners, developers, general contractors, etc.), subcontractors or suppliers, as well as failure to promptly recover significant working capital invested in projects subject to such matters; the requirement to perform extra, or change order, work resulting in disputes or claims or adversely affecting our working capital, profits and cash flows; a significant slowdown or decline in economic conditions; risks and other uncertainties associated with assumptions and estimates used to prepare financial statements; impairment of our goodwill or other indefinite-lived intangible assets; inability to retain key members of our management, to hire and retain personnel required to complete projects or implement succession plans for key officers; failure to meet our obligations under our debt agreements; failure to meet contractual schedule requirements, which could result in higher costs and reduced profits or, in some cases, exposure to financial liability for liquidated damages and/or damages to customers; failure of our joint venture partners to perform their venture obligations, which could impose additional financial and performance obligations on us, resulting in reduced profits or losses; increased competition and failure to secure new contracts; client cancellations of, or reductions in scope under, contracts reported in our backlog; decreases in the level of government spending for infrastructure and other public projects; possible systems and information technology interruptions, including due to cyberattack, systems failures or other similar events; the impact of inclement weather conditions on projects; failure to comply with laws and regulations related to government contracts; uncertainty from the expected discontinuance of the London Interbank Offered Rate and transition to any other interest rate benchmark; conversion of our outstanding Convertible Notes that could dilute ownership interests of existing stockholders and could adversely affect the market price of our common stock; the potential dilutive impact of our Convertible Notes in our diluted EPS calculation; economic, political and other risks, including civil unrest, security issues, labor conditions, corruption and other unforeseeable events in countries where we do business, resulting in unanticipated losses; and other risks and uncertainties discussed under the heading “Risk Factors” in our Annual Report on Form 10-K for the year ended December 31, 2018 filed on February 27, 2019 and in other reports that we file with the Securities and Exchange Commission from time to time. The Company undertakes no
except as may be required under applicable securities laws.
2
* Includes multiple subsidiaries The Cosmopolitan Resort and Casino, Las Vegas
3
4
(approximate award values)
5
California High-Speed Rail Project, Central California East Side Access Project, New York Newark Airport Terminal One, Newark Central Subway T-Line Extension, San Francisco
(financials are LTM through Q2-19; backlog as of quarter-end) A Leading Construction Services Firm
Revenue: $4.4B Adjusted Income from Construction Ops.(1) (ICO): $199.0M(2) Adjusted Op. Margin (1): 4.5% Adjusted Net Income Attributable to TPC(1): $79.3M Q2-19 Backlog: $11.4B
Building Segment
Revenue: $1.8B ICO: $37.8M(3)
Q2-19 Backlog: $2.9B
Civil Segment
Revenue: $1.7B ICO: $203.5M(3)
Q2-19 Backlog: $6.2B Commonly uses guaranteed maximum price and cost plus fee contracts Specializes in:
Commonly uses fixed price and unit price contracts Specializes in:
Facilities
Specialty Contractors Segment
Revenue: $876M ICO: $17.7M(3)
Q2-19 Backlog: $2.3B Commonly uses fixed price, unit price and cost plus fee contracts Specializes in:
(1) Non-GAAP financial measure. See Appendix for a reconciliation of non-GAAP financial measures to the most nearly comparable GAAP financial measures. (2) Includes the impact of corporate general and administrative expenses of $59.8M; excludes other income of $3.7M (3) Segment ICO amounts do not sum to total ICO amount due to corporate general and administrative expenses and rounding.
6
Construction and rehabilitation of highways, bridges, tunnels, mass-transit systems and wastewater treatment facilities TPC’s highest margin segment (11.8% adjusted operating margin(1) over last 12 mos.) Focused on large-scale, complex projects ($100M to $1B+) One of few leaders in the industry positioned to capture the largest projects
— Faces fewer competitors, as smaller contractors lack the technical experience, capability and bonding capacity to support large projects — Strong self-performance capabilities — Centralized, experienced cost estimating capabilities and sizeable equipment fleet
Very strong bidding activity and bid pipeline over the next several years Significant infrastructure spending boost expected due to recent voter- approved funding measures (e.g., $120B L.A. County Measure M; $54B Seattle Sound Transit 3), $52B 10-year California transportation bill and any potential new federal infrastructure program Experience and past performance on projects Financial strength key to obtaining bonding and pre-bid qualification Only major U.S. or international contractor with an office in Guam (presence for 40 years)
— Prepared for multi-billion-dollar troop relocation project opportunities CA High-Speed Rail, CA
7
East Side Access Project, NY
Bridges 7% Mass Transit & Transportation 82% Other 11%
(1) Non-GAAP financial measure. See Appendix for a reconciliation of this non-GAAP financial measure to the most nearly comparable GAAP financial measure.
Large and active bid pipeline over at least the next two years — Significant volume of prospective awards for projects in California and nationwide Strong customer relationships and end market expertise Integrated business model with significant self-perform capabilities Established track record on numerous large government contracts Leading Builder in California Large Corporate Customer Base Private / Non-Residential and Public Projects Expertise in Hospitality and Gaming, Design-Build and Accelerated Delivery Southeastern U.S. Focus Private / Non-Residential and Public Projects Construction and design-build services worldwide for U.S. military and government agencies and surety companies
CityCenter Las Vegas
8
The Cosmopolitan Resort & Casino, Las Vegas
Commercial & Industrial 19% Government 14% Health Care 6% Hospitality and Gaming 24% Mixed Use 1% Condos 9% Education 5% Other 2% Mass Transit 20%
Strong demand, especially in New York City and California Strong electrical and mechanical proficiencies Performing substantial work for the Civil and Building groups — Positions TPC as a full-service contractor with greater control over scheduled work, project delivery, and cost and risk management Continuing to serve existing external customers Focused on New York City, Texas, California and Florida 9
East Side Access Queens Tunnels, NY World Trade Center, NY
One of the largest electrical contractors in New York City Electrical contractor with offices in Houston, Miami, New Orleans and Los Angeles Mechanical contractor with offices in New York City and Miami Mechanical contractor with offices in Los Angeles and Las Vegas Expertise in Pneumatic Concrete Placement Offices in Los Angeles and New York City
Condos 17% Mass Transit & Transportation 60% Commercial & Industrial 6% Mixed Use 3% Other 1% Education 4% Health Care 1% Water 8%
capabilities proving to be a competitive advantage
Greater control over schedule Greater visibility into price
10
Hudson Yards Development, New York Central Subway T-Line Extension, San Francisco
11
(as of Q2-19)
12
Private 25% $2.8B Federal Gov't 5% $0.6B State and Local Government 70% $8.0B Civil 54% $6.2B Building 25% $2.9B Specialty Contractors 20% $2.3B
(as of August 8, 2019)
14
15
East Side Access Project, New York
16
17
(1) Consists of corporate general and administrative expenses
Reconciliation of Income (Loss) from Construction Operations and Operating Margin to Adjusted Income (Loss) from Construction Reconciliation of Net Income (Loss) Attributable to Tutor Perini Corporation Operations and Adjusted Operating Margin to Adjusted Net Income (Loss) Attributable to Tutor Perini Corporation ($ in Thousands) ($ in Thousands) LTM Q2-19 LTM Q2-19 Revenue 4,390,183 Net Income (Loss) Attributable to Tutor Perini Corporation (250,211) Income (Loss) from Construction Operations (180,818) Adjust for Goodwill Impairment Charge 379,863 Operating Margin (4.1%) Adjust for Tax Benefit Provided on Goodwill Impairment Charge (50,374) Adjust for Goodwill Impairment Charge (Q2 2019, pre-tax) 379,863 Adjusted Net Income (Loss) Attributable to Tutor Perini Corporation 79,278 Adjusted Income (Loss) from Construction Operations 199,045 Adjusted Operating Margin 4.5% Breakdown by Segment: Civil Segment Revenue 1,727,658 Income (Loss) from Construction Operations (6,749) Operating Margin (0.4%) Adjust for Goodwill Impairment Charge (Q2 2019, pre-tax) 210,215 Adjusted Income (Loss) from Construction Operations 203,466 Adjusted Operating Margin 11.8% Building Segment Revenue 1,786,263 Income (Loss) from Construction Operations 24,301 Operating Margin 1.4% Adjust for Goodwill Impairment Charge (Q2 2019, pre-tax) 13,455 Adjusted Income (Loss) from Construction Operations 37,756 Adjusted Operating Margin 2.1% Specialty Contractors Segment Revenue 876,262 Income (Loss) from Construction Operations (138,542) Operating Margin (15.8%) Adjust for Goodwill Impairment Charge (Q2 2019, pre-tax) 156,193 Adjusted Income (Loss) from Construction Operations 17,651 Adjusted Operating Margin 2.0% Corporate (1) (59,828)