
SLIDE 1
Metsä Group
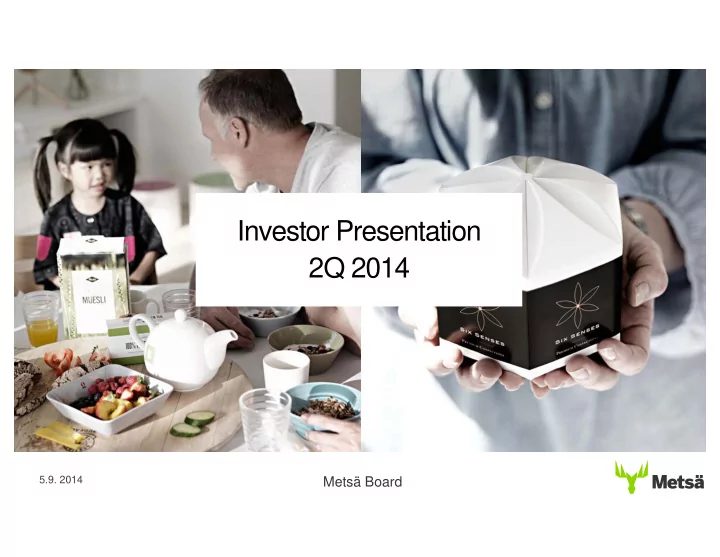
Metsä Board
Investor Presentation 2Q 2014
5.9. 2014
Investor Presentation 2Q 2014 5.9. 2014 Mets Board Mets Group - - PowerPoint PPT Presentation
Investor Presentation 2Q 2014 5.9. 2014 Mets Board Mets Group Content Investment highlights and update General presentation 3 Investment Highlights 52 General Info 4 Financial Targets and Dividend 62 Business Portfolio 9
Metsä Group
Metsä Board
5.9. 2014
Metsä Group
Metsä Board
2
Investment highlights and update 3 Investment Highlights 4 Financial Targets and Dividend 9 Strategy 25 2Q 2014 Results & Outlook 35 Price Development 38 Investments Funding and debt information 41 Divestments 42 Funding and Debt 49 Credit Facilities 50 Rating History General presentation 52 General Info 62 Business Portfolio 69 Operations 75 Deliveries 77 Sourcing 85 Sustainability 90 Owners 92 Market Positions
Metsä Group
Metsä Board
‒ Strong growing core in high-quality paperboards
‒ European market leader in folding boxboard and global market leader in coated white top kraftliner ‒ Increased capacity in the most profitable part of the company, folding boxboard and linerboard ‒ Good further growth potential in both folding boxboard and linerboard
‒ Profitability of the paperboard production top class in its field ‒ Significant net debt reduction in recent years ‒ Material productivity improvement in recent years
3
Metsä Group
Metsä Board
Metsä Group
Metsä Board
‒ ROCE target set at a minimum of 10% on average over the business cycle ‒ Net gearing not to exceed 100%
Minimum ROCE 10%* Maximum net gearing 100%
* Excluding non-recurring items
184% 119% 137% 82% 95% 126% 99% 90% 84% 83% 106% 72% 65% 70% 83% 145%
99 00 01 02 03 04 05 06 07 08 09 10 11 12 13 2Q14
Maximum level of 100% 13,5% 6,2% 2,1% 1,6% 0,5% 0,9% 2,8%
7,6% 3,4% 4,8% 6,4% 8,8% 10,2% 7,6%
99 00 01 02 03 04 05 06 07 08 09 10 11 12 13 1H14
Minimum target of 10%
5
Metsä Group
Metsä Board
6
‒ Increase of folding boxboard and linerboard sales and secure healthy price levels ‒ Gradual reduction of unprofitable paper production in Husum ‒ Profitability improvement of Gohrsmühle mill ‒ Continuous improvement of productivity and cost competitiveness ‒ Efficient supply chain and working capital management
Metsä Group
Metsä Board
least 1/3 of the Company's EPS on average over the business cycle, nonetheless taking into account the Company's net gearing target
7
Metsä Group
Metsä Board
0,50 1,09 1,13 1,85 0,46 0,30
0,52 0,26 0,37 0,38 0,51 0,51 0,51 0,25 0,00 0,00 0,00 0,09 0,19 0,23
0,09 0,12 0,12 0,14 0,06 0,06 0,06 0,00
3,0% 3,4% 7,2% 8,6% 6,9% 5,5% 5,6% 4,1% 3,3% 2,8% 2,1% 1,4% 1,3% 0,0% 4,3% 0,0% 0,0% 0,0%
0,5 1 1,5 2 2,5 3 1996 1997 1998 1999 2000 2001 2002 2003 2004 2005 2006 2007 2008 2009 2010 2011 2012 2013 € per share
0 % 2 % 4 % 6 % 8 % 10 % 12 % Dividend yield, % Earnings per share Dividend per share Dividend yield
Dividend yield calculated from annual average B-share volume weighted price
8
Metsä Group
Metsä Board
Metsä Group
Metsä Board
10
‒ Paperboard is Metsä Board’s core business
‒ Focus on high-quality paperboards
‒ Smaller but healthier paper business
‒ Heavy re-engineering and successful divestments
‒ Extensive fibre know-how and pulp self-sufficiency
‒ Metsä Board’s role in Metsä Fibre’s planned new pulp mill in Äänekoski to be clarified latest early next year
‒ Continuous development towards Super Productivity
Largest Folding Boxboard Producers in Europe
Source: Metsä Board, Pöyry Management Consulting Oy
Largest White Top Kraftliner and Fully Bleached Kraftliner Producers in Europe
Holmen
Metsä Group
Metsä Board
11
Sales distribution 2Q 2014
Paperboard 61% Paper 24% Market pulp 15%
Sales distribution 2006
Paper 56% Paperboard 18% Paper merchanting 26%
Metsä Group
Metsä Board
Year end 12
Capacity per employee in Metsä Board’s board, paper and pulp mills
300 600 900 1 200 1 500 1 800 2006 2007 2008 2009 2010 2011 2012 2013
tonnes/a/person
Metsä Group
Metsä Board
Wood fibre based materials 36 % Others 64 %
‒ Growing population ‒ Urbanization ‒ Environmental awareness ‒ Safety
Source: Smithers Pira
13
Highest growth in paperboard packaging, accounting for the largest share of the total
Metsä Group
Metsä Board
‒ Increasing sales ‒ Improving sustainability ‒ Securing product safety ‒ Decreasing costs
14
Lower quality recycled fibre paperboards Metsä Board’s grades’ global demand growth 3-4 %/a Recycled and fresh forest fibre based cartonboards and linerboards High-quality fresh forest fibre cartonboards and linerboards
Metsä Group
Metsä Board
15
Consumer Goods Companies Fresh forest fibre linerboard
Graphical end-uses
Carton printers Merchants Corrugated box manufacturers
Folding boxboard
Metsä Group
Metsä Board
16
Operating result, excl. non-recurring items, % of sales
Metsä Group
Metsä Board
‒ Metsä Board continues to offer an ecological, safe and cost competitive option for brand owners to replace plastics and recycled fibre board ‒ Totally new business in food service and cup stock end uses
‒ Large and fast growing segment
‒ Best-in class customer service concept
‒ New advanced supply chain model ‒ Good technical service
‒ Healthy price levels a key priority for Metsä Board also in the future
17
Sources: Smithers Pira & Metsä Board
Total cartonboard market 7 million t/a Demand growth 2 %/a WLC 50% FBB 35% SBS 7% CUK 8%
Metsä Group
Metsä Board
‒ Metsä Board is the cartonboard quality benchmark in Asia ‒ Responsible consumer goods companies promote good packaging
‒ Sustainability ‒ Traceable raw materials ‒ Product safety
‒ Leading Chinese producers not in general targeting the highest quality segment
‒ Fast demand growth in commodity segment ‒ Lack of high quality raw material
‒ Metsä Board continues to grow in Chinese high quality segment and increases activities in other main Asian markets
18
Sources: Metsä Board & Risi
Total cartonboard market 15 million t/a Demand growth 5%/a WLC 73% FBB 22% Others 5%
Metsä Group
Metsä Board
‒ Sustainability and safety increasingly important also for North American brand owners ‒ Consumption mainly in conventional heavy cartonboards ‒ Four leading cartonboard producers dominate US market and most of them are integrated to converting
‒ Product development has not been in focus ‒ No investments in new technology and capacity ‒ Difficult position for independent non-integrated converters
‒ Timing is perfect for Metsä Board to become a strong long-term partner for local brand owners and converters
‒ Metsä Board’s FBB even over 30% lighter in weight ‒ Customer service ability as good as best local players’
19
Sources: Smithers Pira & Metsä Board
Total cartonboard market 6,5 million t/a Demand growth 1 %/a WLC 34% SBS 34% CUK 27% FBB 5%
Metsä Group
Metsä Board
‒ Successful transformation of Kemi mill to high end doublecoated segment
‒ Profitability to a totally new level ‒ Fully booked for several years
‒ Husum’s light weight fully bleached linerboards complete Metsä Board’s
‒ Steady decrease of unprofitable paper volumes in Husum
‒ 70 % growth in North America during the past 5 years
‒ USA today the biggest single market ‒ All leading corrugated box manufacturers as main customers
20
Metsä Board’s fresh forest fibre linerboard deliveries in 1H 2014
EMEA 63% Americas 36% Asia-Pacific 1%
Metsä Board’s fresh forest fibre linerboard deliveries to North America, 1,000 tonnes
30 60 90 120 150 2009 2010 2011 2012 2013
+70%
Metsä Group
Metsä Board
‒ Limited availability of high quality fibre
‒ Sustainably harvested high quality fresh forest fibres are a must ‒ Own state of art chemical, mechanical and BCTMP pulping capacity vital competitive factors
‒ Leading global consumer goods companies and corrugated box manufacturers not willing to change paperboard suppliers easily in the high-quality segments
‒ High speed packaging lines very quality sensitive ‒ Requirements for uniform brand look and feel globally ‒ Sustainability and product safety aspects
‒ Skilled people and organizations a crucial success factor
‒ High-quality paperboard companies have traditions from several generations
21
Metsä Group
Metsä Board
Folding boxboard
‒ Continued steady growth in Europe ‒ Aggressive growth in North America to over 200 000 t/a in mid-term ‒ Food service and cup stock deliveries to over 100 000 t/a in mid-term
Fresh forest fibre linerboard
‒ Fully utilize Kemi’s new doublecoated products market potential ‒ Maximize Husum’s light-weight linerboard volumes ‒ Total linerboard sales to exceed 650 000 t/a in mid-term
22
Paperboard deliveries, 1,000 tonnes
200 500 800 1 100 1 400 2011 2012 2013
1000 tonnes
+12%
Metsä Group
Metsä Board
1.Increase folding boxboard sales further based on the light weight concept
23
Metsä Group
Metsä Board
24
Carta Dedica
Light weight cup stock and food service board
Carta Allura
Luxury packaging board
Modo Northern Light Coated
High quality liner for corrugated and microflute packaging
Metsä Group
Metsä Board
Metsä Group
Metsä Board
‒ Paperboard delivery volume continued to increase. Increase of FBB sales to North American markets progressed as planned ‒ Price levels of the main products were stable ‒ Profitability weakened due to successfully completed annual maintenance shutdowns at Husum and Metsä Fibre’s Äänekoski and Joutseno mills ‒ Clear net debt reduction to EUR 540 million due to very strong cash flow ‒ Introduction of new folding boxboards and linerboards proceeded successfully ‒ Mika Joukio appointed as the new CEO latest as of 1 December 2014
26
Metsä Group
Metsä Board
30 19 29 28 6 25 20 24 26 36
10 20 30 40 50 1Q12 2Q12 3Q12 4Q12 1Q13 2Q13 3Q13 4Q13 1Q14 2Q14
545 522 532 509 535 503 479 502 501 494
200 400 600 800 1Q12 2Q12 3Q12 4Q12 1Q13 2Q13 3Q13 4Q13 1Q14 2Q14
17 10 9 19 9 18 4 20 21
10 20 30 40 1Q12 2Q12 3Q12 4Q12 1Q13 2Q13 3Q13 4Q13 1Q14 2Q14
Sales, m€ Operating result excl. non-rec. items, m€ Result before taxes excl. non-rec. items, m€
27
Metsä Group
Metsä Board
‒ Result was improved mainly by higher folding boxboard delivery volumes ‒ Result was weakened by Metsä Fibre’s Äänekoski and Joutseno pulp mills’ annual shutdowns ‒ Folding boxboard price level was stable in 2Q 2014 and no material changes are expected in the coming months ‒ Folding boxboard deliveries are expected to slightly increase in 3Q 2014 ‒ Good service ability for North American customers guaranteed by increased inventories ‒ Great start for recently launched folding boxboards Carta Dedica for cups and plates and Carta Allura for luxury packaging
28
EBIT, excl. non-recurring items Sales
m€ m€
18 20 20 12 15 10 6 12 18 24 30
1Q13 2Q13 3Q13 4Q13 1Q14 2Q14
219 214 208 220 218 222 50 100 150 200 250
1Q13 2Q13 3Q13 4Q13 1Q14 2Q14
Metsä Group
Metsä Board
‒ Result was weakened mainly by the scheduled annual maintenance shutdowns at Husum and Metsä Fibre’s Äänekoski and Joutseno mills ‒ Fresh forest fibre linerboard deliveries were at strong level but decreased slightly from previous quarter. Prices were stable ‒ Paper delivery volumes decreased and prices remained stable at low levels ‒ Market pulp delivery volumes increased and prices were stable ‒ Fresh forest fibre linerboard deliveries are expected to increase slightly in 3Q. Paper and pulp deliveries are forecast to remain at previous quarter level ‒ No material price changes in sight in the main products ‒ Kemi maintenance shutdown has some negative result impact in 3Q
29
EBIT, excl non-recurring items
m€ m€
Sales
20 15 15 16 7 20 5 10 15 20 25 30
1Q13 2Q13 3Q13 4Q13 1Q14 2Q14
271 262 288 269 267 250 50 100 150 200 250 300 350
1Q13 2Q13 3Q13 4Q13 1Q14 2Q14
Metsä Group
Metsä Board
30
‒ Metsä Board’s operating result, excluding non- recurring items is in the third quarter of 2014 expected to improve slightly from the second quarter of 2014
Metsä Group
Metsä Board
‒ Metsä Board’s paperboard deliveries increased in 1H 2014
Europe ‒ Target is to further grow both FBB and fresh forest fibre linerboard businesses
‒ Continued growth in Europe and increased efforts in Asia and especially in North America
‒ Sentiment in paperboard market has further improved in recent weeks and order inflows have somewhat strengthened
31
169 176 185 185 189 192 197 185 191 197 80 85 93 85 94 93 95 91 109 108
50 100 150 200 250 300 350
1 Q 1 2 2 Q 1 2 3 Q 1 2 4 Q 1 2 1 Q 1 3 2 Q 1 3 3 Q 1 3 4 Q 1 3 1 Q 1 4 2 Q 1 4
Fresh forest fibre linerboard Folding boxboard
Paperboard deliveries, 1000 tonnes
Metsä Group
Metsä Board
32
‒ Missing piece to the North American cartonboard offering enabling the enhancement of sustainability ‒ Even over 30 % lighter in weight than competing paperboards ‒ Long-term contracts signed with several leading North American converters and merchants ‒ Target in 2014 is to at least double FBB deliveries to North America from the 35 000 tonnes last year
5 10 15 20 25 2Q13 3Q13 4Q13 1Q14 2Q14
FBB deliveries to North America, 1,000 tonnes
+200 %
Metsä Group
Metsä Board
33
‒ Kemi’s production will by end 2014 focus almost fully on higher value added coated grades. Uncoated grades will mostly be produced in Husum
‒ Kemi mill’s annual capacity will be increased from 375 000 to 400 000 tonnes
‒ Husum’s linerboard production developing as planned to exceed 100 000 tonnes in 2014 ‒ Target is to benefit Husum’s full linerboard production potential of close to 300 000 tonnes during the next few years ‒ Capacity additions have been announced also by other producers. Market balance in the high quality segment is expected to remain healthy
Metsä Group
Metsä Board
34
Cost item Share of total costs Cost change in 2014 vs. 2013 Wood 22 %
Logistics 14 % +2 % Chemicals, pigments and fillers 15 % 0 % Energy 14 %
Fixed costs 32 % +1 % Fixed and variable costs total
No cost inflation expected in 2014
Metsä Group
Metsä Board
EUR / tonne
35
Source: Pöyry Management Consulting
800 900 1000 1100 2004 2005 2006 2007 2008 2009 2010 2011 2012 2013 2014
Metsä Group
Metsä Board
36
500 600 700 800 900 2009 2010 2011 2012 2013 2014
Source: Foex
Metsä Group
Metsä Board
EUR / tonne
Coated fine paper (100 g) Uncoated fine paper (B-copy, 80 g) Softwood pulp NBSK Coated magazine paper LWC (60g)
Source: Foex, Reuters
EUR/USD EUR/USD
400 500 600 700 800 900 1000 1100 2000 2001 2002 2003 2004 2005 2006 2007 2008 2009 2010 2011 2012 2013 2014
0,8 0,9 1 1,1 1,2 1,3 1,4 1,5 1,6 1,7
37
Metsä Group
Metsä Board
Metsä Group
Metsä Board
40 67 66 95 73 72 128 259 428 100 200 300 400 500 2006 2007 2008 2009 2010 2011 2012 2013 2014 M illion €
*Indicative level for 2014
39
Metsä Group
Metsä Board
40
Metsä Group
Metsä Board
2004 Metsä Tissue 570 2002 Papierfabrik Albbruck 235 2001 MD Papier 300 2001 Noviant (19%) 41 3,671
Year Divestiture Enterprise Value
m€
2005 Savon Sellu 20 2005 Forestia (95%) 163 2005 Botnia (8%) 164 2007 Botnia (9%) 240 2007 Folding carton plants 60 2007 Map Merchant Group 382 2008 New Thames mill 82** 2008 100 000 B2 shares in PVO 80 2008 Graphic Papers 750
* Cash portion **Incl. pension liabilities
2009 Metsä-Botnia’s Uruguayn operations 300* 2011 Hallein 34
41
2012 0.5 % stake in PVO 64 2012 7.3 % stake in Metsä Fibre 138 2013 Alizay property and other assets 22 2014 Lielahti real estate
26
Metsä Group
Metsä Board
‒ Gross debt EUR 699 million and net debt EUR 540 million ‒ Net gearing 65 %, equity ratio 40 % and average interest rate reduced to 4.2% at the end of 2Q 2014 ‒ Funds from operations increased to EUR 102 million in 2Q ‒ ONWC reduced clearly from 1Q due to accounts payable improvement measures and timing reasons ‒ Solid liquidity position of over EUR 400 million
42
Net Debt / EBITDA Net Debt, m€
540 827 250 500 750 1000
2010 2011 2012 2013 2Q14
2,5 2,7 1 2 3 4 5
2010 2011 2012 2013 2Q14
Metsä Group
Metsä Board
At the end of 2Q 2014 ‒ Average maturity of long term loans 3,8 years ‒ Average interest rate of loans (including derivatives) 4,2 % ‒ Interest rate maturity of loans (including derivatives) 33 months ‒ Of the loans about 24 per cent was subject to variable interest rates and 76 per cent to fixed interest rates
43
Metsä Group
Metsä Board
44
Long-Term Interest Bearing Liabilities 30.6. 2014
32 % 8 % 3 % 29 % 28 % Bonds Pension premium loans Loans from financial institutions Finance leases Other interest bearing liabilities
Total 693 m€
Metsä Group
Metsä Board
‒ Long-term 693 ‒ Short-term 6 Total interest bearing liabilities 699 ‒ Liquidity and interest bearing receivables 159 Interest bearing net liabilities 540
45
m€
Metsä Group
Metsä Board
14 100 34 83 181 253 24 4 100 14 50 100 150 200 250 300 2014 2015 2016 2017 2018 2019 2020 >2 020 Long-term interest bearing liabilities Committed undrawn credit facilities
m€
46
Long-term Interest Bearing Liabilities and Committed Undrawn Credit Facilities 30.6.2014
Metsä Group
Metsä Board
47
777 827 783 625 597 540 17,7 2,7 4,4 3,4 2,9 2,5 100 200 300 400 500 600 700 800 900 2009 2010 2011 2012 2013 2Q 14 2 4 6 8 10 12 14 16 18 20
Net Debt and Net Debt/EBITDA* Net Gearing, %
65 84 83 106 72 70
20 40 60 80 100 120 2009 2010 2011 2012 2013 2Q14
Net debt, m€ Net debt/EBITDA *Excluding non-recurring items
Metsä Group
Metsä Board
39,8 33,3 32,4 38,7 40,7 41,0 5 10 15 20 25 30 35 40 45
1Q13 2Q13 3Q13 4Q13 1Q14 2Q14
65 69 70 75 74 69 10 20 30 40 50 60 70 80
1Q13 2Q13 3Q13 4Q13 1Q14 2Q14
Equity Ratio Net gearing
% %
48
Metsä Group
Metsä Board
49 The following table sets forth the significant debt securities issued and outstanding of Metsä Board as at June 30, 2014 Average Long-term borrowings Total amount Outstanding I nterest Rate * ) Maturity EUR 225 million Bond Issue 2014 EUR 225 EUR 225 4,5 % 2019 Syndicated credit facility 2014 EUR 250 EUR 150 5,1 % 2018 EUR 103 million bilateral loans EUR 103 EUR 103 3,6 % 2014-2017 EUR 24 million finance leases EUR 24 EUR 24 2,3 % 2014-2020 EUR 210 million pension loans EUR 210 EUR 195 3,8 % 2014–2020 *) The average interest rate take into account outstanding interest rate swaps and amortised arrangement fees. Average interest rate of all Metsä Board interest bearing liabilities including interest rate derivatives per 30.6.2014 is 4,2 %. The following table sets forth Metsä Board´s principal long-term liquidity reserves as at June 30, 2014: Average Liquidity reserves Total amount Outstanding I nterest Rate * ) Maturity (EUR in millions) Revolving Credit Facility 2014 EUR 100 EUR 0 – 2018 Pension loan facilities EUR 210 EUR 195 3,8 %
Metsä Group internal short-term limit EUR 150 EUR 0 – 0-12 months Metsä Group Treasury funding programmes: EUR 150 million domestic CP-program EUR 150 EUR 2 0,4 % 0-12 months (currency in millions)
Metsä Group
Metsä Board
2000 S&P: Short term ratings lowered to A3, Long term ratings placed to credit watch negative Moody’s: Long and short term ratings
2001 S&P: Long term ratings lowered to BBB-, stable outlook Moody’s: Long and short term ratings lowered to Baa3/P3, negative outlook 2003 S&P: Downgrade to BB+, stable outlook Moody’s: Downgrade to Ba1, negative
2004 S&P: Outlook changed from stable to negative, ratings affirmed Moody’s: Downgrade to Ba2, stable outlook 2005 S&P: Downgrade to BB, stable outlook Moody’s: Outlook changed from stable to negative, ratings affirmed 2006 S&P: Downgrade to BB-, negative outlook Moody’s: Downgrade to Ba3, negative outlook Moody’s: Downgrade to B2, negative outlook S&P: Downgrade to B+, negative outlook 2007 Moody’s: Downgrade to B3, negative outlook S&P: Downgrade to B, negative outlook S&P: Downgrade to B-, stable outlook 2008 S&P: Outlook to negative 2009 S&P: Downgrade to CCC+, negative outlook Moody’s: Downgrade to Caa1, outlook negative 2010 S&P: Outlook to stable Moody’s: Outlook to stable S&P: Upgrade to B-, stable outlook Moody’s: Upgrade to B3, outlook to positive 2011 S&P: Outlook to positive S&P: Outlook to stable Moody’s: Outlook to stable 2012 Moody’s: Outlook to positive 2013 S&P: Outlook to positive Moody’s: Upgrade to B2, outlook stable S&P: Upgrade to B, outlook stable Moody’s: Outlook to positive
50
Metsä Group
Metsä Board
51
Moody’s Standard & Poor’s
2005 2006 2007 2008 2009 2010 2011 2012 2013
BB+ | Ba1 BB | Ba2 BB- | Ba3 B+ | B1 B | B2 B- | B3 CCC+ | Caa1 CCC | Caa2
Positive Positive
Metsä Group
Metsä Board
Metsä Group
Metsä Board
‒ Annual sales about 2.0 b€ ‒ The leading European fresh forest fibre paperboard company ‒ Major uncoated fine and printing paper and market pulp supplier ‒ Valuable holdings in Metsä Fibre and Pohjolan Voima ‒ Main customers are brand owners, printers, corrugated packaging manufacturers, merchants and office products suppliers ‒ Global sales and customer service network in 70 countries and nine production units in Finland, Sweden and Germany ‒ Listed on the NASDAQ OMX Helsinki Ltd and a part of Metsä Group,
53
Metsä Group
Metsä Board
‒ Cartonboards and white-top fresh forest fibre linerboards for packaging beautycare, healthcare, cigarettes, food, consumer durables etc. ‒ Graphic boards e.g. for book covers, postcards, greeting cards, CD or DVD covers ‒ Office papers from high-volume copying and printing to high-quality color presentations ‒ Speciality papers for advertising and corporate materials, creative designs, labeling and for wallcovering industry
54
Metsä Group
Metsä Board
Office product resellers Brand owners Printers and converters Advertising and design agencies Office paper users Paper merchants
55
Metsä Group
Metsä Board
17 % 32 % 12 % 9 % 12 % 6 % 9 % 3 % Paper Pulp Paperboard Packaging Tissue Mechanical Forest Products Merchanting Chemicals
59 % 25 % 16 %
1995 Sales €2.3 billion 2013 Sales €2.0 billion 8 Businesses 3 Businesses
56
Metsä Group
Metsä Board Acquisitions Divestments
Biberist Paper Mill Simpele Mill UK Paper Modo Paper Zanders Chemicals Business Botnia Wood Corrugated Packaging MD Papier Metsä Tissue Albbruck
Savon Sellu Forestia Kemiart Liners (53 %) 8% in Botnia PSM 9% in Botnia Carton plants
Map
100 000 B2 shares in PVO New Thames MB Uruguay Graphic Papers Part of Reflex Hallein mill
1997 2000 1998 1999 2001 2002 2003 2004 2005 2006 2007 2009 2008 2010 2011
57
Rest of Reflex 0.5% in PVO
2012
7.3 % in Metsä Fibre
2013 2014
Alizay mill Lielahti real estate
Metsä Group
Metsä Board
2019 2108 2485 2605 2432 3236 4440 5624 5241 5460 6044 6564 6923 5898 3319 3014 2313 4044 1000 2000 3000 4000 5000 6000 7000 8000 1996 1997 1998 1999 2000 2001 2002 2003 2004 2005 2006 2007 2008 2009 2010 2011 2012 2013
EUR, million
58
Metsä Group
Metsä Board
59
EBITDA excl. non-recurring items, m€
114 208 186 179 305 44 60 120 180 240 300 2009 2010 2011 2012 2013 1H 2014
Metsä Group
Metsä Board
CEO Mikko Helander* Linerboard and Paper Seppo Puotinen* Cartonboard Ari Kiviranta* Business Services and Development Sari Pajari* Purchasing Jani Suomalainen* CFO Markus Holm* HR Susanna Tainio
* Member of Corporate Management Board
60
Metsä Group
Metsä Board
61
‒ MSc (Tech), MBA ‒ CEO of Metsä Tissue Corporation since 2012 ‒ Extensive experience in Metsä Board’s paperboard businesses including
‒ Head of paperboard business area and deputy to the CEO ‒ Several mill manager positions ‒ Head of corporate logistics and supply chain
Metsä Group
Metsä Board
62
Metsä Group
Metsä Board
63
Metsä Group
Metsä Board
Cartonboard Linerboard and Paper
64
Metsä Group
Metsä Board
‒ High quality and ecological folding boxboard and packaging solutions for global brand owners in beautycare, healthcare, cigarette, food and consumer electronics industries as well as for graphical end-uses ‒ European market leader and global quality leader in folding boxboard ‒ Strong growth in folding boxboard, high earnings stability and segment consolidation ‒ Top class folding boxboard mills with end use specified production
Capacity Share (%) 8 % 8 % 13 % 25 % 34 % 0 % 5 % 10 % 15 % 20 % 25 % 30 % 35 % 40 % Cascades IP Mayr-Melnhoff Stora Enso Metsä Board
Source: Pöyry Management Consulting Oy 65
Metsä Group
Metsä Board
Capacity Share (%)
11 % 14 % 17 % 27 % 28 % 0 % 5 % 10 % 15 % 20 % 25 % 30 % SCA Mondi BillerusKorsnäs Metsä Board SmurfitKappa
Source: Pöyry Management Consulting Oy
66
Metsä Group
Metsä Board
Sales, m€ 2Q 2014 1Q 2014
67
214 271 219 262
50 100 150 200 250 300 350 Cartonboard Linerboard and Paper
18 20 20 15
6 12 18 24 30 Cartonboard Linerboard and Paper
Operating result, excluding non-recurring items, m€
Metsä Group
Metsä Board
1H 2014 1H 2013
68
Sales, m€
440 557 433 532
100 200 300 400 500 600 Cartonboard Linerboard and Paper
32 27 38 35
10 20 30 40 50 Cartonboard Linerboard and Paper
Operating result, excluding non-recurring items, m€
Metsä Group
Metsä Board
Metsä Group
Metsä Board
200 400 600 800 1 000 1 200 1 400 1 600 1 800 2 000 Paper Board Pulp and BCTMP
1000 tons/a
70
Metsä Group
Metsä Board
Cartonboard:
Linerboard and Pulp:
Husum Gohrsmühle Äänekoski Simpele Joutseno Kemi Tako Kyro Kaskinen
71
Metsä Group
Metsä Board
(1000 t/a)
72
PAPERBOARD AND PAPER MI LLS Country Machines Folding Kraftliner Uncoated Speciality Coated Total Boxboard Fine Paper Paper Paper Tampere (Tako) Finland 2 205 205 Kyröskoski (Kyro) Finland 2 190 105 295 Äänekoski Finland 1 240 240 Simpele Finland 1 300 300 Kemi Finland 1 375 375 Husum Sweden 3 120 420 260 800 Bergisch Gladbach (Gohrsmühle) Germany 2 50 50 Total 12 935 495 420 155 260 2265
Metsä Group
Metsä Board
(1000 t/a)
73
PULP MI LLS Country Chemical BCTMP Pulp Total Husum Sweden 750 750 Joutseno Finland 290 290 Kaskinen Finland 300 300 Total 750 590 1340 METSÄ FI BRE * Country Chemical Pulp Total Äänekoski Finland 500 500 Kemi Finland 590 590 Rauma Finland 650 650 Joutseno Finland 690 690 Total 2430 2430 * Metsä Board's share is 24.9% of the capacity
Metsä Group
Metsä Board
3116 3279 4070 4538 4903 6546 9508 14125 15154 16490 21070 22237 17351 20372 5000 10000 15000 20000 25000 2000 2001 2002 2003 2004 2005 2006 2007 2008 2009 2010 2011 2012 2013
74
Metsä Group
Metsä Board
Metsä Group
Metsä Board
76
Fresh Forest Fibre Linerboard Folding Boxboard
26 % 13 % 13 % 48 % Western Europe Eastern Europe Americas Asia and Pacific 6 % 57 % 1 % 36 %
9 % 85 % 6 %
Uncoated Fine Paper
Metsä Group
Metsä Board
Metsä Group
Metsä Board
Personnel 15 % Other fixed 17 % Delivery costs 14 % Wood 22 % Chemicals, pigments and fillers 15 % Other variables 3 % Energy 14 %
* Percentage of annual costs in industrial operations
78
Metsä Group
Metsä Board
Through PVO shareholding 29 % Outsourced generation 2 % Own generation 20 % Purchased energy 49 %
79
Metsä Group
Metsä Board
Wood-based 58 % Nuclear power 22 % Natural gas 6 % Oil 2 % Peat 2 % Coal 5 % Hydro 5 %
80
Metsä Group
Metsä Board
1 000 m3 Sweden 1 789 Finland 1 191 Baltic countries 1 074 Russia 764 Total 4 818
81
Metsä Group
Metsä Board
1980 – 1Q 2014
Source: Pöyry Management Consulting Oy 82
EUR/m³sob
Metsä Group
Metsä Board
1980 – 1Q 2014
Source: Pöyry Management Consulting Oy 83
EUR/m³sob
Metsä Group
Metsä Board
1980 – 1Q 2014
Source: Pöyry
Source: Pöyry Management Consulting Oy 84
EUR/m³sob
Metsä Group
Metsä Board
Metsä Group
Metsä Board WE OFFER SUSTAINABLE CHOICES
Product and services
innovations
THE SMALLER THE ENVIRONMENTAL IMPACT THE BETTER
Environmental efficiency
WE BRING FOREST TO YOU
Supply chain and raw materials
nature values
forest owners
WE CREATE WELL-BEING
Internal and external stakeholders
86
Metsä Group
Metsä Board
87
SUSTAINABILITY TARGETS
SUPPLY CHAIN ETHICAL BUSINESS PRACTICES WELL-BEING ENERGY AND CLIMATE
COVERAGE OF CODE OF CONDUCT TRAINING
COVERAGE OF SUPPLIER CODE OF CONDUCT LOST-TIME ACCIDENTS SHARE OF CERTIFIED WOOD ABOVE80%
WOOD
SICKNESS ABSENTEEISM BELOW3% ENERGY EFFICIENCY +10%
Metsä Group
Metsä Board
Metsä Board paperboards are in compliance with the regulation
launched: to audit 100% of risk rated key material suppliers against sustainability criteria by end 2015 92 % of all Metsä Board purchases, excluding wood, come from countries where we have own production
88
Metsä Board’s purchases by country % Exluding wood supply
Metsä Group
Metsä Board
15% from 2010
since 2009
89
Metsä Board Greenhouse gas effect (CO2 equivalent, 1,000 tonnes)
Metsä Group
Metsä Board
90
Metsä Group
Metsä Board
Shares Votes
Source: Euroland
91
Metsä Group
Metsä Board
Metsä Group
Metsä Board
100 200 300 400 500 600 700 800 900 1000 Others Holmen Cascades IP Mayr-Melnhof Stora Enso Metsä Board
Capacity: tons/year (thousand) 34% 25% 13% 8% 8% 7% 5%
Source: Pöyry Management Consulting Oy
93
Metsä Group
Metsä Board
100 200 300 400 500 600 Others SCA Mondi BillerudKorsnäs Metsä Board Smurfit Kappa
Capacity: tons/year (thousand) 28% 27% 17% 14% 11%
Source: Metsä Board, Pöyry Management Consulting Oy
94
3%
Metsä Group
Metsä Board
500 1000 1500 2000 2500 3000 3500 Others Double A Arctic Paper Metsä Board UPM International Paper Stora Enso Mondi Portucel
BIG-5 = 58% of total
14% 12% 12% 10% 8% 4% 3% 3% 29% Capacity: tons/year (thousand)
Source: Pöyry Management Consulting Oy
95
Metsä Group
Metsä Board
Headof IR +358 10 4654335 juha.laine@metsagroup.com