investigation on interfacial properties of cnt alumina
play

INVESTIGATION ON INTERFACIAL PROPERTIES OF CNT/ALUMINA - PDF document

18 TH INTERNATIONAL CONFERENCE ON COMPOSITE MATERIALS INVESTIGATION ON INTERFACIAL PROPERTIES OF CNT/ALUMINA NANOCOMPOSITES USING PULL-OUT SIMULATION BASED ON MOLECULAR MECHANICS S. Liu, N. Hu* Department of Mechanical Engineering, Chiba


  1. 18 TH INTERNATIONAL CONFERENCE ON COMPOSITE MATERIALS INVESTIGATION ON INTERFACIAL PROPERTIES OF CNT/ALUMINA NANOCOMPOSITES USING PULL-OUT SIMULATION BASED ON MOLECULAR MECHANICS S. Liu, N. Hu* Department of Mechanical Engineering, Chiba University, Chiba city, Japan * Corresponding author( huning@faculty.chiba-u.jp ) Keywords: interfacial property, molecular mechanics, carbon nanotube, alumina 1 Introduction Carbon nanotube (CNT) has attracted widespread attention in the fields of polymer and ceramics based composites. As for mechanical properties of CNT/ceramics composites, the interfacial properties between CNT and ceramics matrix is a key issue. However, all of previous studies are limited to the interfacial properties between CNT and various polymer matrices, or between two neighboring walls CNT in a multi-wall carbon nanotube (MWCNT) [1]. In F this work, as an extension of our previous work [1], CNT Alumina molecular mechanics (MM) simulations of the pull- grain out process of a CNT from an alumina matrix using Alumina x the Materials Studio (Accelrys) were carried out, aiming at investigating the interfacial characteristics 
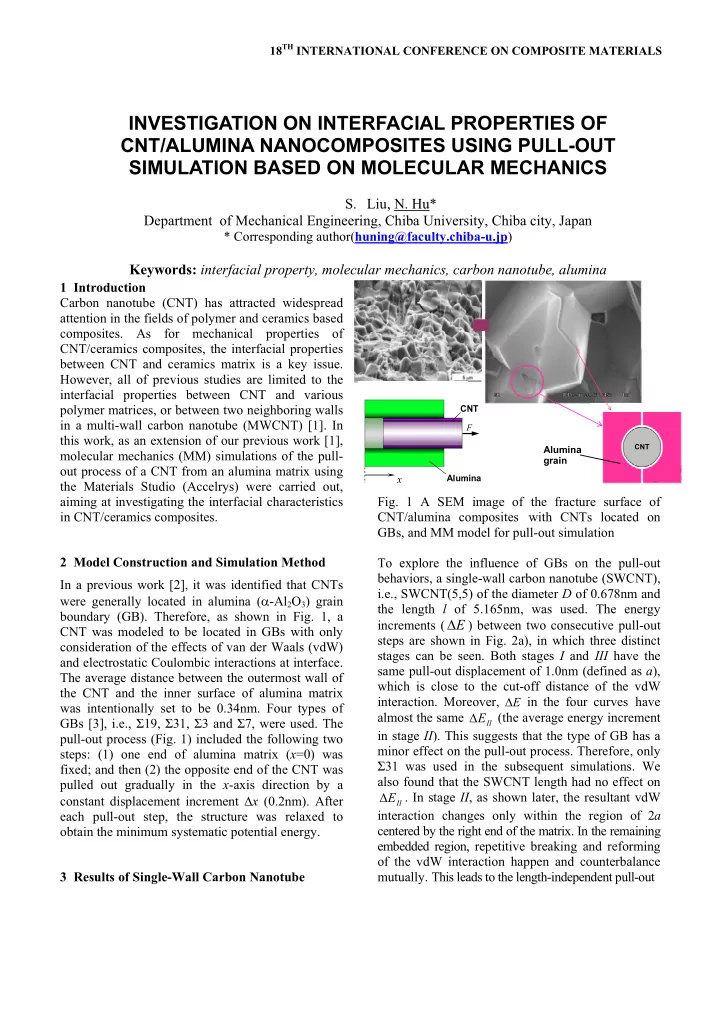
Fig. 1 A SEM image of the fracture surface of in CNT/ceramics composites. CNT/alumina composites with CNTs located on GBs, and MM model for pull-out simulation 2 Model Construction and Simulation Method To explore the influence of GBs on the pull-out behaviors, a single-wall carbon nanotube (SWCNT), In a previous work [2], it was identified that CNTs i.e., SWCNT(5,5) of the diameter D of 0.678nm and were generally located in alumina ( α -Al 2 O 3 ) grain the length l of 5.165nm, was used. The energy boundary (GB). Therefore, as shown in Fig. 1, a ∆ increments ( E ) between two consecutive pull-out CNT was modeled to be located in GBs with only steps are shown in Fig. 2a), in which three distinct consideration of the effects of van der Waals (vdW) stages can be seen. Both stages I and III have the and electrostatic Coulombic interactions at interface. same pull-out displacement of 1.0nm (defined as a ), The average distance between the outermost wall of which is close to the cut-off distance of the vdW the CNT and the inner surface of alumina matrix interaction. Moreover, ∆ in the four curves have E was intentionally set to be 0.34nm. Four types of ∆ almost the same (the average energy increment E GBs [3], i.e., Σ 19, Σ 31, Σ 3 and Σ 7, were used. The II in stage II ). This suggests that the type of GB has a pull-out process (Fig. 1) included the following two minor effect on the pull-out process. Therefore, only steps: (1) one end of alumina matrix ( x =0) was Σ 31 was used in the subsequent simulations. We fixed; and then (2) the opposite end of the CNT was also found that the SWCNT length had no effect on pulled out gradually in the x -axis direction by a ∆ . In stage II , as shown later, the resultant vdW E constant displacement increment ∆ x (0.2nm). After II interaction changes only within the region of 2 a each pull-out step, the structure was relaxed to centered by the right end of the matrix. In the remaining obtain the minimum systematic potential energy. embedded region, repetitive breaking and reforming of the vdW interaction happen and counterbalance 3 Results of Single-Wall Carbon Nanotube mutually. This leads to the length-independent pull-out

  2. 0 2 4 6 8 10 a) converged γ II was obtained as 0.303 N/m. This γ II is a) 10 60 Ⅰ Ⅱ Ⅲ new for the interface of SWCNT and alumina matrix Energy increment ∆ E (kcal/mol) although there have been some previously reported 8 50 γ II , e.g., 0.09~0.12 N/m [4] and 0.1 N/m [5] between SWCNT and polyethylene matrix, and 0.14 N/m [1] 40 6 between two neighboring CNT walls. The present γ II Σ 7 30 is much higher than those previous values [1,4,5], 4 Σ 3 implying a stronger interface. Moreover, as shown in 20 Σ 31 [1] for the pull-out among nested walls in a 2 MWCNT, the maximum pull-out force occurs at the Σ 19 10 end of stage I if the capped effect is modeled. SWCNT(5,5); D= 0.678nm; l= 5.165nm Similar to that in [1], we can predict this maximum 0 0 0 1 2 3 4 5 pull-out force using the above γ II . Pull-out displacement x (nm) a. 0 2 4 6 8 10 a) b) 240 10 D= 0.678 nm Energy increment ∆ E (kcal/mol) 210 D= 1.356 nm 8 D= 2.034 nm 180 D= 2.712 nm 150 6 120 4 90 b) 60 2 30 GB Σ 31; l =5.165nm 0 0 0 1 2 3 4 5 Pull-out displacement x (nm) Fig. 2 Energy increment during pull-out of SWCNT (5, 5): a) effect of alumina GB type on energy increment; b) effect of nanotube diameter on energy increment behavior. Then, various SWCNTs with the same length c) of 5.165nm were used to explore the influence of CNT diameter D (Fig. 2b)). A key feature in Fig. 2b) is that increases linearly with D , which was fitted as: ∆ E II ∆ = × + E II 52 .0 4 D 9 .0 36 − , and D in nm) (1) 1 ( ∆ in kcal mol E II Therefore, the SWCNT pull-out force in stage II can be simply calculated as: = ∆ ∆ = × + F E / x 1.807 D 0.314 II II ( F in nN, and D in nm) (2) II In view of that two new surface regions are Fig. 3 ISS distribution: a) a pull-out simulation generated at the two ends of CNT after each pull-out model of a simple CNT unit cell; b) real pull-out step (Fig. 1), the surface energy density γ II can be force variation and averaged pull-out force; c) . The average shear stress τ 0 calculated as: γ = ∆ π ∆ = π E /( 2 D x ) F /( 2 D ) II II II

  3. INVESTIGATION ON INTERFACIAL PROPERTIES OF CNT/ALUMINA NANOCOMPOSITES USING PULL-OUT SIMULATION BASED ON MOLECULAR MECHANICS Based on the above results, the interface shear a) stress (ISS) in stage II was analyzed. A SWCNT(5, F 5) ( D =0.678 nm) with only a half repeated unit in the length direction, embedded in the middle F position of matrix (Fig. 3a)), was used. The obtained energy increment ∆ E ω and the pull-out force F ω for ∆ x =0.1 nm are shown in Fig. 3b). It can be found that the pull-out force only exists within the region b) of 2 a =2.0 nm centered by the right end of matrix. Therefore, the ISS can be solely distributed within the region of 2 a in stage II (Fig. 3c)). The pull-out F force was further averaged within the region of 2 a , F i.e., F . By assuming that the ISS is uniform within * ω this region (2 a ), the average of ISS τ 0 in stage II can τ = * π be defined from * as: . The F /( 2 Da ) F ω ω 0 obtained converged τ 0 from various unit cells of c) SWCNT with various diameters was 303 MPa. F ∆ E cc D o + 4 Results of Multi-Wall Carbon Nanotube ≈ F For MWCNTs, the number of walls ( n ) was limited ∆ E II D o to 2 and 3 for a double-wall carbon nanotube F ∆ E s D o (DWCNT) and a triple-wall carbon nanotube (TWCNT) to reduce the computational cost. Two typical cases were studied, i.e., Case 1: simultaneous pull-out of all walls (Fig. 4a)); Case 2: only pull-out Fig. 4 Two typical pull-out cases of MWCNT ( n =2 or 3); a) pull-out of the whole MWCNT (Case 1); b) of the outermost wall with the fixed inner walls (see ∆ pull-out of the outmost wall of MWCNT (Case 2); c) E Fig. 4b)). The obtained was also found to be II decomposition of Case 2 into two independent sub- proportional to the diameter of the outermost wall of problems D ) as follows: MWCNT ( o ⎧ ∆ = × + = the above ∆ E II , the pull-out force F II , the surface E 57 . 54 D 4 . 36 n 2 (3a) Case 1 II o ⎨ energy density γ II and the average ISS τ 0 of ∆ = × + = (3b) E 58 . 26 D 6 . 50 n 3 ⎩ II o DWCNTs and TWCNTs were obtained, which were ∆ = × + = ⎧ E 93 . 61 D 10 . 17 n 2 (4a) II o 1.106 and 1.120 times higher than those of SWCNT, Case 2 ⎨ ∆ = × + = (4b) E 96 . 60 D 10 . 50 n 3 ⎩ respectively. For Case 2, the results obtained from II o the sliding behavior between nested walls in a For Case 1, the above results plus that for ∆ E SWCNT are shown in Fig. 5. It can be found that the MWCNT were adopted [1]. It was found that II slope of linear Eq. (3a) ( n =2) is 9.56% higher than of Eq. (4b) was approximately equal to the sum of that of Eq. (2) (SWCNT), which highlights the ∆ and ∆ of two independent sub-problems. As E E cc s contribution of the first inner wall to ∆ E II . However, ∆ shown in Fig. 5c), E was the potential energy the slope of Eq. (3b) ( n =3) is only 1.24% higher than cc increment for a TWCNT when only the outermost that of Eq. (3a) ( n =2), which implies that the wall was pulled out against the other two inner walls contribution of the innermost wall of TWCNT is ∆ = × − ∆ [1], i.e., E 36 . 15 D 15 . 75 . Moreover, E remarkably weakened due to the increase of the cc o s distance of this wall to the sliding surface. Therefore, for was the potential energy increment of the pull-out of MWCNTs with more walls over 3, ∆ E II is a SWCNT from the alumina matrix, i.e., Eq. (2). approximately equal to that of Eq. (3b). Based on Therefore, based on the combinations of various 3

Download Presentation
Download Policy: The content available on the website is offered to you 'AS IS' for your personal information and use only. It cannot be commercialized, licensed, or distributed on other websites without prior consent from the author. To download a presentation, simply click this link. If you encounter any difficulties during the download process, it's possible that the publisher has removed the file from their server.

Recommend


More recommend