Introduction to Number of Probability favorable outcomes - - PDF document

introduction to
SMART_READER_LITE
LIVE PREVIEW

Introduction to Number of Probability favorable outcomes - - PDF document

Slide 1 / 188 Slide 2 / 188 7th Grade Statistics and Probability 2015-11-19 www.njctl.org Slide 3 / 188 Slide 3 (Answer) / 188 Table of Contents Table of Contents Click on a topic to Click on a topic to go to that section. go to that


slide-1
SLIDE 1

Slide 1 / 188 Slide 2 / 188

7th Grade

Statistics and Probability

2015-11-19 www.njctl.org

Slide 3 / 188 Table of Contents

· Introduction to Probability · Experimental and Theoretical · Word Problems · Probability of Compound Events

Click on a topic to go to that section.

· Sampling · Measures of Center · Measures of Variation · Mean Absolute Deviation · Glossary

Slide 3 (Answer) / 188 Table of Contents

· Introduction to Probability · Experimental and Theoretical · Word Problems · Probability of Compound Events

Click on a topic to go to that section.

· Sampling · Measures of Center · Measures of Variation · Mean Absolute Deviation · Glossary

[This object is a pull tab]

Teacher Notes

Vocabulary Words are bolded in the presentation. The text box the word is in is then linked to the page at the end

  • f the presentation with the

word defined on it.

Slide 4 / 188

Introduction to Probability

Click to go to Table of Contents

Slide 5 / 188

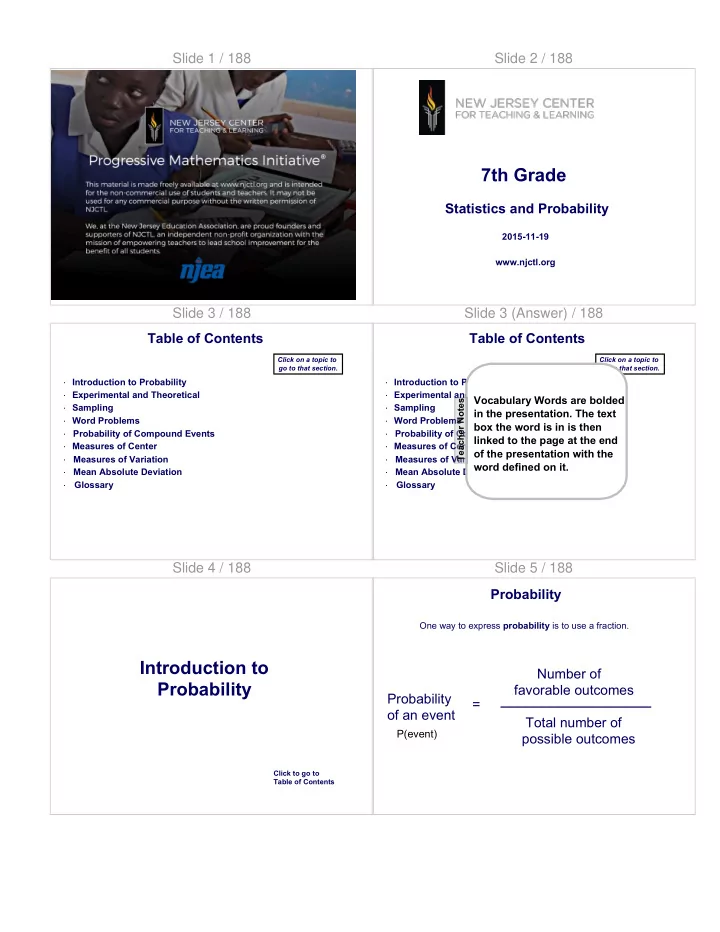
One way to express probability is to use a fraction.

Number of favorable outcomes Total number of possible outcomes Probability

  • f an event

=

P(event)

Probability

slide-2
SLIDE 2

Slide 6 / 188

Example: What is the probability of flipping a nickel and the nickel landing on heads? Step 1: What are the possible outcomes? Step 2: What is the number of favorable outcomes? Step 3: Put it all together to answer the question. The probability of flipping a nickel and landing on heads is: 1 2

click

click

click

Probability Slide 6 (Answer) / 188

Example: What is the probability of flipping a nickel and the nickel landing on heads? Step 1: What are the possible outcomes? Step 2: What is the number of favorable outcomes? Step 3: Put it all together to answer the question. The probability of flipping a nickel and landing on heads is: 1 2

click

click

click

Probability

[This object is a pull tab]

Answer

The outcomes become your denominator. P(heads) = The favorable

  • utcomes become

your numerator. P(heads) =

Slide 7 / 188

Probability can be expressed in many forms. For example, the probability of flipping a head can be expressed as: 1 or 50% or 1:2 or 0.5 2 The probability of randomly selecting a blue marble can be expressed as: 1 or 1:6 or 16.7% or .167 6

Probability Slide 8 / 188

When there is no chance of an event occurring, the probability of the event is zero (0). When it is certain that an event will occur, the probability of the event is one (1). 1 4 1 2 3 4 1 I m p

  • s

s i b l e U n l i k e l y Equally Likely L i k e l y C e r t a i n The less likely it is for an event to occur, the probability is closer to 0 (i.e. smaller fraction). The more likely it is for an event to occur, the probability is closer to 1 (i.e. larger fraction).

Probability Slide 9 / 188

Without counting, can you determine if the probability of picking a red marble is lesser or greater than 1/2? It is very likely you will pick a red marble, so the probability is greater than 1/2 (or 50% or 0.5)

Click to Reveal

What is the probability of picking a red marble? 5 6

Click to Reveal

Add the probabilities of both events. What is the sum? 1 + 5 = 1 6 6

Click to Reveal

Probability Slide 10 / 188 Note:

The sum of all possible outcomes is always equal to 1. There are three choices of jelly beans - grape, cherry and orange. If the probability of getting a grape is 3/10 and the probability of getting cherry is 1/5, what is the probability of getting orange? 3 + 1 + ? = 1 10 5 ? 5 + ? = 1 10 ? The probability of getting an orange jelly bean is 5 . 10

Probability

slide-3
SLIDE 3

Slide 11 / 188

1 Arthur wrote each letter of his name on a separate card and put the cards in a bag. What is the probability of drawing an A from the bag? A B 1/6 C 1/2 D 1

A R T H U R

Probability = Number of favorable outcomes Total number of possible outcomes

Click for hint

Slide 11 (Answer) / 188

1 Arthur wrote each letter of his name on a separate card and put the cards in a bag. What is the probability of drawing an A from the bag? A B 1/6 C 1/2 D 1

A R T H U R

Probability = Number of favorable outcomes Total number of possible outcomes

Click for hint

[This object is a pull tab]

Answer

B

Slide 12 / 188

2 Arthur wrote each letter of his name on a separate card and put the cards in a bag. What is the probability of drawing an R from the bag? A B 1/6 C 1/3 D 1

A R T H U R

Probability = Number of favorable outcomes Total number of possible outcomes

A

Click for hint

Slide 12 (Answer) / 188

2 Arthur wrote each letter of his name on a separate card and put the cards in a bag. What is the probability of drawing an R from the bag? A B 1/6 C 1/3 D 1

A R T H U R

Probability = Number of favorable outcomes Total number of possible outcomes

A

Click for hint

[This object is a pull tab]

Answer

C

Slide 13 / 188

3 Matt's teacher puts 5 red, 10 black, and 5 green markers in a bag. What is the probability of Matt drawing a red marker? A 0 B 1/4 C 1/10 D 10/20 Probability = Number of favorable outcomes Total number of possible outcomes

Click for hint

Slide 13 (Answer) / 188

3 Matt's teacher puts 5 red, 10 black, and 5 green markers in a bag. What is the probability of Matt drawing a red marker? A 0 B 1/4 C 1/10 D 10/20 Probability = Number of favorable outcomes Total number of possible outcomes

Click for hint

[This object is a pull tab]

Answer

B

slide-4
SLIDE 4

Slide 14 / 188

4 What is the probability of rolling a 5 on a fair number cube?

Slide 14 (Answer) / 188

4 What is the probability of rolling a 5 on a fair number cube?

[This object is a pull tab]

Answer

1/6

Slide 15 / 188

5 What is the probability of rolling a composite number on a fair number cube?

Slide 15 (Answer) / 188

5 What is the probability of rolling a composite number on a fair number cube?

[This object is a pull tab]

Answer

1/3

Slide 16 / 188

6 What is the probability of rolling a 7 on a fair number cube?

Slide 16 (Answer) / 188

6 What is the probability of rolling a 7 on a fair number cube?

[This object is a pull tab]

Answer

slide-5
SLIDE 5

Slide 17 / 188

7 You have black, blue, and white t-shirts in your

  • closet. If the probability of picking a black t-shirt is

1/3 and the probability of picking a blue t-shirt is 1/2, what is the probability of picking a white t-shirt?

Slide 17 (Answer) / 188

7 You have black, blue, and white t-shirts in your

  • closet. If the probability of picking a black t-shirt is

1/3 and the probability of picking a blue t-shirt is 1/2, what is the probability of picking a white t-shirt?

[This object is a pull tab]

Answer

1/6

Slide 18 / 188

8 If you enter an online contest 4 times and at the time of drawing its announced there were 100 total entries, what are your chances of winning?

Slide 18 (Answer) / 188

8 If you enter an online contest 4 times and at the time of drawing its announced there were 100 total entries, what are your chances of winning?

[This object is a pull tab]

Answer

1/25

Slide 19 / 188

9 Mary chooses an integer at random from 1 to 6. What is the probability that the integer she chooses is a prime number? A B C D

From the New York State Education Department. Office of Assessment Policy, Development and

  • Administration. Internet. Available from www.nysedregents.org/IntegratedAlgebra; accessed 17,

June, 2011.

Slide 19 (Answer) / 188

9 Mary chooses an integer at random from 1 to 6. What is the probability that the integer she chooses is a prime number? A B C D

From the New York State Education Department. Office of Assessment Policy, Development and

  • Administration. Internet. Available from www.nysedregents.org/IntegratedAlgebra; accessed 17,

June, 2011. [This object is a pull tab]

Answer

B

slide-6
SLIDE 6

Slide 20 / 188

10 Each of the hats shown below has colored marbles placed inside. Hat A contains five green marbles and four red marbles. Hat B contains six blue marbles and five red marbles. Hat C contains five green marbles and five blue marbles. If a student were to randomly pick one marble from each of these three hats, determine from which hat the student would most likely pick a green

  • marble. Justify your answer.

A Hat B Hat C Hat

From the New York State Education Department. Office of Assessment Policy, Development and

  • Administration. Internet. Available from www.nysedregents.org/IntegratedAlgebra; accessed 17, June, 2011

Slide 20 (Answer) / 188

10 Each of the hats shown below has colored marbles placed inside. Hat A contains five green marbles and four red marbles. Hat B contains six blue marbles and five red marbles. Hat C contains five green marbles and five blue marbles. If a student were to randomly pick one marble from each of these three hats, determine from which hat the student would most likely pick a green

  • marble. Justify your answer.

A Hat B Hat C Hat

From the New York State Education Department. Office of Assessment Policy, Development and

  • Administration. Internet. Available from www.nysedregents.org/IntegratedAlgebra; accessed 17, June, 2011

[This object is a pull tab]

Answer

Hat A P(green) = 5/9 Hat B P(green) = 0 Hat C P(green) = 1/2

Slide 21 / 188

Determine the fewest number of marbles, if any, and the color

  • f these marbles that could be added to each hat so that the

probability of picking a green marble will be one-half in each

  • f the three hats.

Hat A contains five green marbles and four red marbles. Hat B contains six blue marbles and five red marbles. Hat C contains five green marbles and five blue marbles.

From the New York State Education Department. Office of Assessment Policy, Development and

  • Administration. Internet. Available from www.nysedregents.org/IntegratedAlgebra; accessed 17,

June, 2011

Slide 21 (Answer) / 188

Determine the fewest number of marbles, if any, and the color

  • f these marbles that could be added to each hat so that the

probability of picking a green marble will be one-half in each

  • f the three hats.

Hat A contains five green marbles and four red marbles. Hat B contains six blue marbles and five red marbles. Hat C contains five green marbles and five blue marbles.

From the New York State Education Department. Office of Assessment Policy, Development and

  • Administration. Internet. Available from www.nysedregents.org/IntegratedAlgebra; accessed 17,

June, 2011 [This object is a pull tab]

Answer

Hat A needs 1 red marble. Hat B needs 11 green marbles. Hat C does not need marbles.

Slide 22 / 188

Experimental & Theoretical Probability

Click to go to Table of Contents

Slide 23 / 188

Click on an object. What is the outcome?

Outcomes

slide-7
SLIDE 7

Slide 24 / 188

number of times the outcome happened

number of times experiment was repeated

Experimental Probability

Flip the coin 5 times and determine the experimental probability of heads. Probability

  • f an event

Heads Tails

Answer

Slide 25 / 188

Example 1 - Golf A golf course offers a free game to golfers who make a hole-in-one on the last hole. Last week, 24 out of 124 golfers achieved this. Find the experimental probability that a golfer makes a hole-in-one on the last hole. Out of 31 golfers, you could expect 6 to make a hole-in-one on the last hole. Or there is a 19% chance of a golfer making a hole-in-one on the last hole.

Experimental Probability

P(hole-in-one) = # of successes # of trials = 24 124 = 6 31

Slide 26 / 188

Example 2 - Surveys Of the first 40 visitors through the turnstiles at an amusement park, 8 visitors agreed to participate in a survey being conducted by park employees. Find the experimental probability that an amusement park visitor will participate in the survey. You could expect 1 out of every 5 people to participate in the survey. Or there is a 20% chance of a visitor participating in the survey.

Experimental Probability

P(participation) = # of successes # of trials = 8 40 = 1 5

Slide 27 / 188

# on Die Picture of Roll Results 1 1 one 2 3 twos 3 1 three 4 0 fours 5 4 fives 6 1 six

Sally rolled a die 10 times and the results are shown below. Use this information to answer the following questions.

Experimental Probability Slide 28 / 188

11 What is the experimental probability of rolling a 5? A 1/2 B 5/4 C 4/5 D 2/5 # on Die Picture of Roll Results 1 1 one 2 3 twos 3 1 three 4 0 fours 5 4 fives 6 1 six

These are the results after 10 rolls of the die Answer

Slide 29 / 188

12 What is the experimental probability of rolling a 4? A 1/2 B 5/4 C D 4/4 # on Die Picture of Roll Results 1 1 one 2 3 twos 3 1 three 4 0 fours 5 4 fives 6 1 six

These are the results after 10 rolls of the die Answer

slide-8
SLIDE 8

Slide 30 / 188

13 Based on the experimental probability you found, if you rolled the die 100 times, how many sixes would you expect to get? A 6 sizes B 10 sixes C 12 sixes D 60 sixes

These are the results after 10 rolls of the die Answer

# on Die Picture of Roll Results 1 1 one 2 3 twos 3 1 three 4 0 fours 5 4 fives 6 1 six

Slide 31 / 188

14 Mike flipped a coin 15 times and it landed on tails 11

  • times. What is the experimental probability of landing
  • n heads?

Slide 31 (Answer) / 188

14 Mike flipped a coin 15 times and it landed on tails 11

  • times. What is the experimental probability of landing
  • n heads?

[This object is a pull tab]

Answer

4/15

Slide 32 / 188 Theoretical Probability

What is the theoretical probability of spinning green? Is this a fair probability?

Slide 32 (Answer) / 188 Theoretical Probability

What is the theoretical probability of spinning green? Is this a fair probability?

[This object is a pull tab]

Answer

1/4

Slide 33 / 188

Probability

  • f an event

Theoretical Probability

number of favorable outcomes

total number of possible outcomes

slide-9
SLIDE 9

Slide 34 / 188 Theoretical Probability

Example 1 - Marbles Find the theoretical probability of randomly choosing a white marble from the marbles shown. There is a 2 in 5 chance of picking a white marble or a 40% possibility. P(white) = # of favorable outcomes # of possible outcomes 4 2 10 5 = =

Slide 35 / 188 Theoretical Probability

Example 2 - Marbles Suppose you randomly choose a gray marble. Find the probability of this event. There is a 3 in 10 chance of picking a gray marble or a 30% possibility. P(gray) = # of favorable outcomes # of possible outcomes 3 10 =

Slide 36 / 188

There is a 1 in 2 chance of getting tails when you flip a coin or a 50% possibility.

Theoretical Probability

Example 3 - Coins Find the probability of getting tails when you flip a coin. P(tails) = # of favorable outcomes # of possible outcomes 1 2 =

Slide 37 / 188

15 What is the theoretical probability of picking a green marble? A 1/8 B 7/8 C 1/7 D 1 R R G W W Y Y B

Slide 37 (Answer) / 188

15 What is the theoretical probability of picking a green marble? A 1/8 B 7/8 C 1/7 D 1 R R G W W Y Y B

[This object is a pull tab]

Answer

A

Slide 38 / 188

16 What is the theoretical probability of picking a black marble? A 1/8 B 7/8 C 1/7 D R R G W W Y Y B

slide-10
SLIDE 10

Slide 38 (Answer) / 188

16 What is the theoretical probability of picking a black marble? A 1/8 B 7/8 C 1/7 D R R G W W Y Y B

[This object is a pull tab]

Answer

D

Slide 39 / 188

17 What is the theoretical probability of picking a white marble? A 1/8 B 7/8 C 1/4 D 1 R R G W W Y Y B

Slide 39 (Answer) / 188

17 What is the theoretical probability of picking a white marble? A 1/8 B 7/8 C 1/4 D 1 R R G W W Y Y B

[This object is a pull tab]

Answer

C

Slide 40 / 188

18 What is the theoretical probability of not picking a white marble? A 3/4 B 7/8 C 1/7 D 1 R R G W W Y Y B

Slide 40 (Answer) / 188

18 What is the theoretical probability of not picking a white marble? A 3/4 B 7/8 C 1/7 D 1 R R G W W Y Y B

[This object is a pull tab]

Answer

A

Slide 41 / 188

19 What is the theoretical probability of rolling a three? A 1/2 B 3 C 1/6 D 1

slide-11
SLIDE 11

Slide 41 (Answer) / 188

19 What is the theoretical probability of rolling a three? A 1/2 B 3 C 1/6 D 1

[This object is a pull tab]

Answer

C

Slide 42 / 188

20 What is the theoretical probability of rolling an odd number? A 1/2 B 3 C 1/6 D 5/6

Slide 42 (Answer) / 188

20 What is the theoretical probability of rolling an odd number? A 1/2 B 3 C 1/6 D 5/6

[This object is a pull tab]

Answer

A

Slide 43 / 188

21 What is the theoretical probability of rolling a number less than 5? A 2/3 B 4 C 1/6 D 5/6

Slide 43 (Answer) / 188

21 What is the theoretical probability of rolling a number less than 5? A 2/3 B 4 C 1/6 D 5/6

[This object is a pull tab]

Answer

A

Slide 44 / 188

22 What is the theoretical probability of not rolling a 2? A 2/3 B 2 C 1/6 D 5/6

slide-12
SLIDE 12

Slide 44 (Answer) / 188

22 What is the theoretical probability of not rolling a 2? A 2/3 B 2 C 1/6 D 5/6

[This object is a pull tab]

Answer

D

Slide 45 / 188

23 Seth tossed a fair coin five times and got five heads. The probability that the next toss will be a tail is A B C D

From the New York State Education Department. Office of Assessment Policy, Development and

  • Administration. Internet. Available from www.nysedregents.org/IntegratedAlgebra; accessed 17, June, 2011.

Slide 45 (Answer) / 188

23 Seth tossed a fair coin five times and got five heads. The probability that the next toss will be a tail is A B C D

From the New York State Education Department. Office of Assessment Policy, Development and

  • Administration. Internet. Available from www.nysedregents.org/IntegratedAlgebra; accessed 17, June, 2011.

[This object is a pull tab]

Answer

D The result of the next toss does not depend

  • n the previous tosses.

Slide 46 / 188

24 Which inequality represents the probability, x, of any event happening? A x ≥ 0 B 0 < x < 1 C x < 1 D 0 ≤ x ≤ 1

From the New York State Education Department. Office of Assessment Policy, Development and

  • Administration. Internet. Available from www.nysedregents.org/IntegratedAlgebra; accessed 17, June, 2011

Slide 46 (Answer) / 188

24 Which inequality represents the probability, x, of any event happening? A x ≥ 0 B 0 < x < 1 C x < 1 D 0 ≤ x ≤ 1

From the New York State Education Department. Office of Assessment Policy, Development and

  • Administration. Internet. Available from www.nysedregents.org/IntegratedAlgebra; accessed 17, June, 2011

[This object is a pull tab]

Answer

D

Slide 47 / 188

25 The spinner shown is divided into 8 equal sections. The arrow on this spinner is spun once. What is the probability that the arrow will land on a section labeled with a number greater than 3? Enter only your fraction.

From PARCC EOY sample test calculator #1

slide-13
SLIDE 13

Slide 47 (Answer) / 188

25 The spinner shown is divided into 8 equal sections. The arrow on this spinner is spun once. What is the probability that the arrow will land on a section labeled with a number greater than 3? Enter only your fraction.

From PARCC EOY sample test calculator #1

[This object is a pull tab]

Answer

  • r equivalent

Slide 48 / 188

26 Reagan will use a random number generator 1,200

  • times. Each result will be a digit form 1 to 6. Which

statement best predicts how many times the digit 5 will appear among the 1,200 results? A It will appear exactly 200 times. B It will appear close to 200 times but probably not exactly 200 times. C It will appear exactly 240 times. D It will appear close to 240 times but probably not exactly 240 times.

From PARCC EOY sample test calculator #17

Slide 48 (Answer) / 188

26 Reagan will use a random number generator 1,200

  • times. Each result will be a digit form 1 to 6. Which

statement best predicts how many times the digit 5 will appear among the 1,200 results? A It will appear exactly 200 times. B It will appear close to 200 times but probably not exactly 200 times. C It will appear exactly 240 times. D It will appear close to 240 times but probably not exactly 240 times.

From PARCC EOY sample test calculator #17

[This object is a pull tab]

Answer

B

Slide 49 / 188 Class Activity

· Each student flips a coin 10 times and records the number of heads and the number of tail outcomes. · Each student calculates the experimental probability of flipping a tail and flipping a head. · Use the experimental probabilities determined by each student to calculate the entire class's experimental probability for flipping a head and flipping a tail.

Slide 50 / 188

Answer the following: What is the theoretical probability for flipping a tail? A head? Compare the experimental probability to the theoretical probability for 10 experiments. Compare the experimental probability to the theoretical probability when the experiments for all of the students are considered?

Class Activity Slide 51 / 188

Sampling

Return to Table of Contents

slide-14
SLIDE 14

Slide 52 / 188

Your task is to count the number of whales in the ocean or the number of squirrels in a park. How could you do this? What problems might you face? A sample is used to make a prediction about an event or gain information about a population. A whole group is called a POPULATION. A part of a group is called a SAMPLE.

Sampling Slide 53 / 188

A sample is considered Example: To find out how many people in New York feel about mass transit, people at a train station are asked their opinion. Is this situation representative of the general population?

Sampling

random (or unbiased) when every possible sample of the same size has an equal chance of being

  • selected. If a sample is biased, then information obtained from it

may not be reliable.

Slide 53 (Answer) / 188

A sample is considered Example: To find out how many people in New York feel about mass transit, people at a train station are asked their opinion. Is this situation representative of the general population?

Sampling

random (or unbiased) when every possible sample of the same size has an equal chance of being

  • selected. If a sample is biased, then information obtained from it

may not be reliable.

[This object is a pull tab]

Answer

  • No. The sample only

includes people who take the train and does not include people who may walk, drive, or bike.

Slide 54 / 188

Determine whether the situation would produce a random sample. You want to find out about music preferences of people living in your area. You and your friends survey every tenth person who enters the mall nearest you.

Sampling Slide 54 (Answer) / 188

Determine whether the situation would produce a random sample. You want to find out about music preferences of people living in your area. You and your friends survey every tenth person who enters the mall nearest you.

Sampling

[This object is a pull tab]

Answer

Yes, this situation would produce a random sample.

Slide 55 / 188

27 Food services at your school wants to increase the number of students who eat hot lunch in the cafeteria. They conduct a survey by asking the first 20 students that enter the cafeteria lunch line to determine the students' preferences for hot lunch. Is this survey reliable? Explain your answer. Yes No

slide-15
SLIDE 15

Slide 55 (Answer) / 188

27 Food services at your school wants to increase the number of students who eat hot lunch in the cafeteria. They conduct a survey by asking the first 20 students that enter the cafeteria lunch line to determine the students' preferences for hot lunch. Is this survey reliable? Explain your answer. Yes No

[This object is a pull tab]

Answer

  • No. The students that are

entering the cafeteria lunch line most likely already buy a hot lunch.

Slide 56 / 188

28 The guidance counselors want to organize a career

  • day. They will survey all students whose ID numbers

end in a 7 about their grades and career counseling

  • needs. Would this situation produce a random

sample? Explain your answer. Yes No

Slide 56 (Answer) / 188

28 The guidance counselors want to organize a career

  • day. They will survey all students whose ID numbers

end in a 7 about their grades and career counseling

  • needs. Would this situation produce a random

sample? Explain your answer. Yes No

[This object is a pull tab]

Answer

Yes

Slide 57 / 188

29 The local newspaper wants to run an article about reading habits in your town. They conduct a survey by asking people in the town library about the number of magazines to which they subscribe. Would this produce a random sample? Explain your answer. Yes No

Slide 57 (Answer) / 188

29 The local newspaper wants to run an article about reading habits in your town. They conduct a survey by asking people in the town library about the number of magazines to which they subscribe. Would this produce a random sample? Explain your answer. Yes No

[This object is a pull tab]

Answer

No

Slide 58 / 188

How would you estimate the size of a crowd? What methods would you use? Could you use the same methods to estimate the number

  • f wolves on a mountain?

Sampling

slide-16
SLIDE 16

Slide 59 / 188

A whole group is called a population. A part of a group is called a SAMPLE. When biologists study a group of wolves, they are choosing a sample . The population is all the wolves on the mountain. Population Sample

Sampling Slide 60 / 188

Suppose this represents all the wolves on the mountain. One way to estimate the number of wolves on a mountain is to use the capture-recapture method.

Sampling Slide 61 / 188

Wildlife biologists first find some wolves and tag them.

Capture-Recapture Method Slide 62 / 188

Then they release them back onto the mountain.

Capture-Recapture Method Slide 63 / 188

They wait until all the wolves have mixed together.Then they find a second group of wolves and count how many are tagged.

Capture-Recapture Method Slide 64 / 188

Biologists use a proportion to estimate the total number of wolves on the mountain: tagged wolves on mountain tagged wolves in second group

total wolves on mountain total wolves in second group

For accuracy, they will often conduct more than one recapture.

=

8 2 w 9 2w = 72 w = 36

=

There are 36 wolves on the mountain

Capture-Recapture Method

slide-17
SLIDE 17

Slide 65 / 188

Try This: Biologists are trying to determine how many fish are in the Rancocas Creek. They capture 27 fish, tag them and release them back into the Creek. 3 weeks later, they catch 45 fish. 7 of them are tagged. How many fish are in the creek? 27 7 f 45 27(45) = 7f 1215 = 7f 173.57 = f = There are 174 fish in the river

Capture-Recapture Method Slide 66 / 188

Try This: 315 out of 600 people surveyed voted for Candidate A. How many votes can Candidate A expect in a town with a population of 1500?

Capture-Recapture Method Slide 66 (Answer) / 188

Try This: 315 out of 600 people surveyed voted for Candidate A. How many votes can Candidate A expect in a town with a population of 1500?

Capture-Recapture Method

[This object is a pull tab]

Answer

= 315 x 600 1,500 787.5 = x about 788 people

Slide 67 / 188

30 Eight hundred sixty out of 4,000 people surveyed watched Dancing with the Stars. How many people in the US watched if there are 93.1 million people?

Slide 67 (Answer) / 188

30 Eight hundred sixty out of 4,000 people surveyed watched Dancing with the Stars. How many people in the US watched if there are 93.1 million people?

[This object is a pull tab]

Answer

860 x 4,000 93,100,000 80,066,000,000 = 4,000x 20,016,500 = x 20,016,500 people watched =

Slide 68 / 188

31 Six out of 150 tires need to be realigned. How many out of 12,000 are going to need to be realigned?

slide-18
SLIDE 18

Slide 68 (Answer) / 188

31 Six out of 150 tires need to be realigned. How many out of 12,000 are going to need to be realigned?

[This object is a pull tab]

Answer

6 x 150 12,000 72,000 = 150x 480 = x 480 tires =

Slide 69 / 188

32 You are an inspector. You find 3 faulty bulbs out of 50. Estimate the number of faulty bulbs in a lot of 2,000.

Slide 69 (Answer) / 188

32 You are an inspector. You find 3 faulty bulbs out of 50. Estimate the number of faulty bulbs in a lot of 2,000.

[This object is a pull tab]

Answer

120 faulty bulbs

Slide 70 / 188

33 You survey 83 people leaving a voting site. 15 of them voted for Candidate A. If 3,000 people live in town, how many votes should Candidate A expect?

Slide 70 (Answer) / 188

33 You survey 83 people leaving a voting site. 15 of them voted for Candidate A. If 3,000 people live in town, how many votes should Candidate A expect?

[This object is a pull tab]

Answer

about 542 votes

Slide 71 / 188

34 The chart shows the number of people wearing different types of shoes in Mr. Thomas' English

  • class. Suppose that there are 300 students in the
  • cafeteria. Predict how many would be wearing

high-top sneakers. Explain your reasoning.

Number of Students Low-top sneakers 12 High-top sneakers 7 Sandals 3 Boots 6

Shoes

Answer

slide-19
SLIDE 19

Slide 72 / 188

35 Josephine owns a diner that is open every day for breakfast, lunch, and dinner. She offers a regular menu and a menu with specials for each of the three meals. She wanted to estimate the percentage of her customers that order form the menu with specials. She selected a random sample of 50 customers who had lunch at her diner during a three-month period. She determined that 28% of these people ordered for the menu with specials. Which statement about Josephine's sample is true? A The sample is the percentage of customers who order from the menu with specials. B The sample might not be representative of the popultation because it only included lunch customers. C The sample shows that exactly 28% of Josephine's customers order from the menu with specials. D No generalizations can be made from this sample, because the sample size of 50 is too small.

From PARCC EOY sample test calculator #13

Slide 72 (Answer) / 188

35 Josephine owns a diner that is open every day for breakfast, lunch, and dinner. She offers a regular menu and a menu with specials for each of the three meals. She wanted to estimate the percentage of her customers that order form the menu with specials. She selected a random sample of 50 customers who had lunch at her diner during a three-month period. She determined that 28% of these people ordered for the menu with specials. Which statement about Josephine's sample is true? A The sample is the percentage of customers who order from the menu with specials. B The sample might not be representative of the popultation because it only included lunch customers. C The sample shows that exactly 28% of Josephine's customers order from the menu with specials. D No generalizations can be made from this sample, because the sample size of 50 is too small.

From PARCC EOY sample test calculator #13

[This object is a pull tab]

Answer

B

Slide 73 / 188 Multiple Samples

The student council wanted to determine which lunch was the most popular among their students. They conducted surveys on two random samples of 100 students. Make at least two inferences based on the results.

Student Sample Hamburgers Tacos

Pizza Total

#1 12

14 74 100

#2 12

11 77 100 · Most students prefer pizza. · More people prefer pizza than hamburgers and tacos combined.

Slide 74 / 188

Try This! The NJ DOT (Department of Transportation) used two random samples to collect information about NJ drivers. The table below shows what type of vehicles were being driven. Make at least two inferences based on the results of the data.

Driver Sample

Cars SUVs Mini Vans Motorcycles Total

#1

37 43 12 8 100

#2

33 46 11 10 100

Multiple Samples

Answer

Slide 75 / 188

The student council would like to sell potato chips at the next basketball game to raise money. They surveyed some students to figure out how many packages of each type of potato chip they would need to buy. For home games, the expected attendance is approximately 250 spectators. Use the chart to answer the next three questions.

Student Sample Regular BBQ Cheddar #1 8 10 7 #2 8 11 6

Slide 76 / 188

36 How many students participated in each survey?

Student Sample Regular BBQ Cheddar #1 8 10 7 #2 8 11 6 Answer

slide-20
SLIDE 20

Slide 77 / 188

37 According to the two random samples, which flavor potato chip should the student council purchase the most of? A Regular B BBQ C Cheddar

Student Sample Regular BBQ Cheddar #1 8 10 7 #2 8 11 6 Answer

Slide 78 / 188

38 Use the first random sample to evaluate the number of packages of cheddar potato chips the student council should purchase.

Student Sample Regular BBQ Cheddar #1 8 10 7 #2 8 11 6 Answer

Slide 79 / 188

Word Problems

Click to go to Table of Contents

Slide 80 / 188

19 shots made 100 shots attempted = 19% Example 1 - Soccer Erica loves soccer! The ladies' coach tells Erica that she scored 19% of her attempts on goal last season. This season, the coach predicts the same percentage for Erica. Erica reports she attempted approximately 1,100 shots on goal last season. Her coach suggests they estimate the number of goals using experimental probability. What do you know about percentages to figure out the relationship of goals scored to goals attempted? Experimental Probability =number of times the outcome happened number of times experiment was repeated number of goals number of attempts Erica's Experimental Probability = Move to Reveal Move to Reveal

click to reveal

Word Problem Slide 81 / 188

19 100 20 100 is very close to so she makes about 20%

  • f her shots on goal.

Let's estimate the number of goals Erica scored. 1,100 is very close to 1,000. So we will estimate that Erica has about 1,000 attempts About what percent would be a good estimate to use? About how many attempts did Erica take? Erica makes 19% of her shots on goal. Erica takes 1,100 shots on goal.

click click

Word Problem Slide 82 / 188

Erica figures she made about 200 of her shots on goal. Erica wants to find 20% of 1,000. Her math looks like this:

click to reveal

Word Problem

slide-21
SLIDE 21

Slide 83 / 188

What are the actual values that will give you 19%?

Challenge

Remember sometimes it helps to turn a percent into a decimal prior to solving the problem.

Click for hint

Word Problem Slide 83 (Answer) / 188

What are the actual values that will give you 19%?

Challenge

Remember sometimes it helps to turn a percent into a decimal prior to solving the problem.

Click for hint

Word Problem

[This object is a pull tab]

Answer

0.19 1,100 = 210 Erica made 210 of her 1,100 shots. 0.19 19% =

Slide 84 / 188

Example 2 - Gardening Last year, Lexi planted 12 tulip bulbs, but only 10

  • f them bloomed. This year she intends to plant 60 tulip bulbs.

Use experimental probability to predict how many bulbs will bloom. Based on her experience last year,Lexi can expect 50

  • ut of 60 tulips to bloom.

Solve this proportion by equivalent fractions.

Experimental Probability

10 bloom 12 total x bloom 60 total = 10 bloom 12 total 50 bloom 60 total =

Slide 85 / 188

Example 3 - Basketball Today you attempted 50 free throws and made 32 of them. Use experimental probability to predict how many free throws you will make tomorrow if you attempt 75 free throws. Based on your performance yesterday,you can expect to make 48 free throws out of 75 attempts. Solve this proportion using cross products.

Experimental Probability

32 75 = 50 x 2400 = 50x 48 = x 32 made 50 attempts x made 75 attempts =

Slide 86 / 188

Number of attempts Number of goals Experimental Probability 100 1000 500 2000 30 600 150 1600 Now, its your turn. Calculate the experimental probability for the number of goals.

Experimental Probability Slide 87 / 188

39 Tom was at bat 50 times and hit the ball 10 times. What is the experimental probability for hitting the ball?

slide-22
SLIDE 22

Slide 87 (Answer) / 188

39 Tom was at bat 50 times and hit the ball 10 times. What is the experimental probability for hitting the ball?

[This object is a pull tab]

Answer 1 or 0.2 or 20% 5

Slide 88 / 188

40 Tom was at bat 50 times and hit the ball 10 times. Estimate the number of balls Tom hit if he was at bat 250 times.

Slide 88 (Answer) / 188

40 Tom was at bat 50 times and hit the ball 10 times. Estimate the number of balls Tom hit if he was at bat 250 times.

[This object is a pull tab]

Answer

50

Slide 89 / 188

41 What is the theoretical probability of randomly selecting a jack from a deck of cards?

Slide 89 (Answer) / 188

41 What is the theoretical probability of randomly selecting a jack from a deck of cards?

[This object is a pull tab]

Answer

1/13

Slide 90 / 188

42 Mark rolled a 3 on a die for 7 out of 20 rolls. What is the experimental probability for rolling a 3?

slide-23
SLIDE 23

Slide 90 (Answer) / 188

42 Mark rolled a 3 on a die for 7 out of 20 rolls. What is the experimental probability for rolling a 3?

[This object is a pull tab]

Answer 7 or 0.35 or 35% 20

Slide 91 / 188

43 Mark rolled a 3 on a die for 7 out of 20 rolls. What is the theoretical probability for rolling a 3?

Slide 91 (Answer) / 188

43 Mark rolled a 3 on a die for 7 out of 20 rolls. What is the theoretical probability for rolling a 3?

[This object is a pull tab]

Answer 1 or 0.16 or 16.7% 6

Slide 92 / 188

44 Some books are laid on a desk. Two are English, three are mathematics, one is French, and four are social

  • studies. Theresa selects an English book and Isabelle

then selects a social studies book. Both girls take their selections to the library to read. If Truman then selects a book at random, what is the probability that he selects an English book?

Slide 92 (Answer) / 188

44 Some books are laid on a desk. Two are English, three are mathematics, one is French, and four are social

  • studies. Theresa selects an English book and Isabelle

then selects a social studies book. Both girls take their selections to the library to read. If Truman then selects a book at random, what is the probability that he selects an English book?

[This object is a pull tab]

Answer

1/8

Slide 93 / 188

45 What is the probability of drawing a king or an ace from a standard deck of cards? A 2/52 B 4/52 C 2/13 D 8/52

slide-24
SLIDE 24

Slide 93 (Answer) / 188

45 What is the probability of drawing a king or an ace from a standard deck of cards? A 2/52 B 4/52 C 2/13 D 8/52

[This object is a pull tab]

Answer

C

Slide 94 / 188

46 What is the probability of drawing a five or a diamond from a standard deck of cards? A 4/13 B 13/52 C 2/13 D 16/52

Slide 94 (Answer) / 188

46 What is the probability of drawing a five or a diamond from a standard deck of cards? A 4/13 B 13/52 C 2/13 D 16/52

[This object is a pull tab]

Answer

A

Slide 95 / 188

Lindsey would like to know the number of people at a movie theater that will buy a movie ticket and popcorn. Based on past data, the probability that a person who is selected at random from those that buy movie tickets and also buy popcorn is 0.6. Lindsey designs a simulation to estimate the probability that exactly two in a group of three people selected randomly at a movie theater will buy both a movie ticket and popcorn. For the simulation Lindsey used a number generator that generates random numbers. · Any number from 1 through 6 represents a person who buys a movie ticket and popcorn. · Any number from 7 through 9

  • r 0 represents a person who

buys only a movie ticket. · Use info for next two questions.

From PARCC EOY sample test calculator #3

Slide 96 / 188

47 Part A In the simulation, one result was "100". What does this result simulate? A No one in a group of three randomly-chosen people who buy movie tickets also buys popcorn. B Exactly one person in a group of three randomly-chosen people who buy movie tickets also buys popcorn. C Exactly two people in a group of three randomly-chosen people who buy movie tickets also buy popcorn. D All three people in a group of three randomly-chosen people who buy movie tickets also buy popcorn.

Slide 96 (Answer) / 188

47 Part A In the simulation, one result was "100". What does this result simulate? A No one in a group of three randomly-chosen people who buy movie tickets also buys popcorn. B Exactly one person in a group of three randomly-chosen people who buy movie tickets also buys popcorn. C Exactly two people in a group of three randomly-chosen people who buy movie tickets also buy popcorn. D All three people in a group of three randomly-chosen people who buy movie tickets also buy popcorn.

[This object is a pull tab]

Answer

Part A: B

slide-25
SLIDE 25

Slide 97 / 188

48 Part B Use the results of the simulation to estimate the probability that exactly two of three people selected at random from those who buy movie tickets will also buy popcorn.

Slide 97 (Answer) / 188

48 Part B Use the results of the simulation to estimate the probability that exactly two of three people selected at random from those who buy movie tickets will also buy popcorn.

[This object is a pull tab]

Answer

Part B

  • r equivalent

Slide 98 / 188

Probability of Compound Events

Click to go to Table of Contents

Slide 99 / 188 Probability of Compound Events

For the probability of compound events, first - decide if the two events are independent or dependent. When the outcome of one event does not affect the outcome of another event, the two events are independent. Use formula: Probability (A and B) = Probability (A) Probability (B)

Slide 100 / 188 Independent Example

Select a card from a deck of cards, replace it in the deck, shuffle the deck, and select a second card. What is the probability that you will pick a 6 and then a king? P (6 and a king) = P(6) P(king) 4 4 = 1 52 52 169

Slide 101 / 188

When the outcome of one event affects the outcome of another event, the two events are dependent. Use formula: Probability (A & B) = Probability(A) Probability(B given A)

Dependent Events

slide-26
SLIDE 26

Slide 102 / 188

Select a card from a deck of cards, do not replace it in the deck, shuffle the deck, and select a second card. What is the probability that you will pick a 6 and then a king?

Dependent Example

P (6 and a king) = P(6) P(king given a six has been selected) 4 4 = 4 52 51 663 Notice your demominator when down by 1. Why?

Slide 103 / 188

Independent Dependent Try to name some other independent and dependent events.

Independent & Dependent Examples Slide 104 / 188

49 The names of 6 boys and 10 girls from your class are put in a hat. What is the probability that the first two names chosen will both be boys? (w/o replacement)

Slide 104 (Answer) / 188

49 The names of 6 boys and 10 girls from your class are put in a hat. What is the probability that the first two names chosen will both be boys? (w/o replacement)

[This object is a pull tab]

Answer 6 x 5 = 1 16 15 8

Slide 105 / 188

50 A lottery machine generates numbers randomly. Two numbers between 1 and 9 are generated. What is the probability that both numbers are 5?

Slide 105 (Answer) / 188

50 A lottery machine generates numbers randomly. Two numbers between 1 and 9 are generated. What is the probability that both numbers are 5?

[This object is a pull tab]

Answer 1 x 1 = 1 9 9 81

slide-27
SLIDE 27

Slide 106 / 188

51 The TV repair person is in a room with 20 broken TVs. Two sets have broken wires and 5 sets have a faulty computer chip. What is the probability that the first TV repaired has both problems?

Slide 106 (Answer) / 188

51 The TV repair person is in a room with 20 broken TVs. Two sets have broken wires and 5 sets have a faulty computer chip. What is the probability that the first TV repaired has both problems?

[This object is a pull tab]

Answer 2 x 5 = 1 20 20 40

Slide 107 / 188

52 What is the probability that the first two cards drawn from a full deck are both hearts? (without replacement)

Slide 107 (Answer) / 188

52 What is the probability that the first two cards drawn from a full deck are both hearts? (without replacement)

[This object is a pull tab]

Answer 13 x 12 = 1 52 51 17

Slide 108 / 188

53 A spinner containing 5 colors: red, blue, yellow, white and green is spun and a die, numbered 1 through 6, is

  • rolled. What is the probability of spinning green and

rolling a two?

Slide 108 (Answer) / 188

53 A spinner containing 5 colors: red, blue, yellow, white and green is spun and a die, numbered 1 through 6, is

  • rolled. What is the probability of spinning green and

rolling a two?

[This object is a pull tab]

Answer 1 x 1 = 1 5 6 30

slide-28
SLIDE 28

Slide 109 / 188

54 A drawer contains 5 brown socks, 6 black socks, and 9 navy blue socks. The power is out. What is the probability that Sam chooses two socks that are both black?

Slide 109 (Answer) / 188

54 A drawer contains 5 brown socks, 6 black socks, and 9 navy blue socks. The power is out. What is the probability that Sam chooses two socks that are both black?

[This object is a pull tab]

Answer 6 x 5 = 3 20 19 38

Slide 110 / 188 Slide 110 (Answer) / 188 Slide 111 / 188

56 A student council has seven officers, of which five are girls and two are boys. If two officers are chosen at random to attend a meeting with the principal, what is the probability that the first officer chosen is a girl and the second is a boy? A B C D

From the New York State Education Department. Office of Assessment Policy, Development and

  • Administration. Internet. Available from www.nysedregents.org/IntegratedAlgebra; accessed 17, June, 2011.

Slide 111 (Answer) / 188

56 A student council has seven officers, of which five are girls and two are boys. If two officers are chosen at random to attend a meeting with the principal, what is the probability that the first officer chosen is a girl and the second is a boy? A B C D

From the New York State Education Department. Office of Assessment Policy, Development and

  • Administration. Internet. Available from www.nysedregents.org/IntegratedAlgebra; accessed 17, June, 2011.

[This object is a pull tab]

Answer A 5 x 2 = 10 7 6 42

slide-29
SLIDE 29

Slide 112 / 188

57 The probability that it will snow on Sunday is . The probability that it will snow on both Sunday and Monday is . What is the probability that it will snow on Monday, if it snowed on Sunday? A B

2

C D

From the New York State Education Department. Office of Assessment Policy, Development and

  • Administration. Internet. Available from www.nysedregents.org/IntegratedAlgebra; accessed 17, June, 2011.

Slide 112 (Answer) / 188

57 The probability that it will snow on Sunday is . The probability that it will snow on both Sunday and Monday is . What is the probability that it will snow on Monday, if it snowed on Sunday? A B

2

C D

From the New York State Education Department. Office of Assessment Policy, Development and

  • Administration. Internet. Available from www.nysedregents.org/IntegratedAlgebra; accessed 17, June, 2011.

[This object is a pull tab]

Answer C 3 ÷ 3 = 1 10 5 2

Slide 113 / 188

Measures of Center

Return to Table of Contents

Slide 114 / 188

Sometimes we can make general statements about a set of data as shown in this first question.

Generalizations Slide 115 / 188

58 Alexis chose a random sample of 10 jars of almonds from each of two different brands, X and Y. Each jar in the sample was the same

  • size. She counted the number of almonds in each jar. Her results

are shown in the plots.

A The number of almonds in jars from Brand X tends to be greater and more consistent than those from Brand Y. B The number of almonds in jars from Brand X tends to be greater and less consistent than those from Brand Y. C The number of almonds in jars from Brand X tends to be fewer and more consistent than those from Brand Y. D The number of almonds in jars from Brand X tends to be fewer and less consistent than those from Brand Y.

From PARCC EOY sample test calculator #7

Slide 115 (Answer) / 188

58 Alexis chose a random sample of 10 jars of almonds from each of two different brands, X and Y. Each jar in the sample was the same

  • size. She counted the number of almonds in each jar. Her results

are shown in the plots.

A The number of almonds in jars from Brand X tends to be greater and more consistent than those from Brand Y. B The number of almonds in jars from Brand X tends to be greater and less consistent than those from Brand Y. C The number of almonds in jars from Brand X tends to be fewer and more consistent than those from Brand Y. D The number of almonds in jars from Brand X tends to be fewer and less consistent than those from Brand Y.

From PARCC EOY sample test calculator #7

[This object is a pull tab]

Answer

B

slide-30
SLIDE 30

Slide 116 / 188

Other times we will make statements about the data based on measure of center and variation that we can calculate. This will be the topics for the rest of this chapter.

Generalizations Slide 117 / 188 Measures of Center - Vocabulary Review

Median - The middle data value when the values are written in numerical order Mean (Average) - The sum of the data values divided by the number of items Mode - The data value that occurs the most often

Slide 118 / 188 Measures of Center

Joey wanted to convince his mom to give him some money for a snack from the concession stand. Below are the prices of the different snacks. $1.75, $0.75, $1.25, $0.75, $2.50, $2.00

Slide 119 / 188

What is the mean of this data set? $1.75, $0.75, $1.25, $0.75, $2.50, $2.00 Step 1: Add up all of the numbers. 1.75 + 0.75 + 1.25 + 0.75 + 2.50 + 2.00 = 9.00 Step 2: Divide the sum by the number of items listed. 9.00 / 6 = 1.50 The mean cost of concession stand snacks is $1.50.

Mean Example Slide 120 / 188

Find the mini mean 1.25 + 1.75 = 1.50 2 What do you do when you have two numbers left? (click)

What is the median of this data set? $1.75, $0.75, $1.25, $0.75, $2.50, $2.00 Step 1: Order the numbers from least to greatest. 0.75, 0.75, 1.25, 1.75, 2.00, 2.50 Step 2: Find the middle value. 0.75, 0.75, 1.25, 1.75, 2.00, 2.50 The median cost of concession stand snacks is $1.50.

Median Example Slide 121 / 188

What is the mode of this data set? $1.75, $0.75, $1.25, $0.75, $2.50, $2.00 Step 1: Look for the number that appears most often. 1.75, 0.75, 1.25, 0.75, 2.50, 2.00 The mode cost of concession stand snacks is $0.75.

Mode Example

slide-31
SLIDE 31

Slide 122 / 188

Mean

$1.50

Median

$1.50

Mode

$0.75

How can Joey use this information to ask his mom for money? $1.75, $0.75, $1.25, $0.75, $2.50, $2.00

Measures of Center Slide 123 / 188

Time Spent Texting Daily by 7th Grade Students (in minutes)

60 15 30 45 75 90 105 120

Girls

60 15 30 45 75 90 105 120

Boys

Measures of Center

Use the dot plots to compare the 2 samples.

Slide 124 / 188

60 15 30 45 75 90 105 120

Girls

Find the mean, median, and mode for the sample of girls.

Measures of Center Slide 124 (Answer) / 188

60 15 30 45 75 90 105 120

Girls

Find the mean, median, and mode for the sample of girls.

Measures of Center

[This object is a pull tab]

Answer

Mean 88.5 min or 1 hr 28 min and 30 sec *Remember to find out how many seconds 0.5 is equal to multiply the decimal by how many seconds are in a

  • minute. 0.5 * 60 seconds = 30 seconds

Median 90 minutes or 1 hour 30 minutes Mode 60 minutes or 1 hour

Slide 125 / 188

60 15 30 45 75 90 105 120

Boys

Measures of Center

Find the mean, median, and mode for the sample of boys.

Slide 125 (Answer) / 188

60 15 30 45 75 90 105 120

Boys

Measures of Center

Find the mean, median, and mode for the sample of boys.

[This object is a pull tab]

Answer Mean 40.5 minutes or 40 minutes and 30 seconds Median 30 seconds Mode 30 minutes and 60 minutes

slide-32
SLIDE 32

Slide 126 / 188

Girls Boys Mean 88.5 40.5 Median 90 30 Mode 60 30 and 60

Measures of Center

Now compare the two measures of center. Make a statement about the average time spent texting daily by 7th grade students. Answer

Slide 127 / 188

59 What is the mean of the stem-and-leaf plot? Stem Leaf 1 1 1 2 2 0 0 3 5 5 4 8 Key: 1 | 1 = 11

Slide 127 (Answer) / 188

59 What is the mean of the stem-and-leaf plot? Stem Leaf 1 1 1 2 2 0 0 3 5 5 4 8 Key: 1 | 1 = 11

[This object is a pull tab]

Answer

25

Slide 128 / 188

60 What is the median of the stem-and-leaf plot? Stem Leaf 1 1 1 2 2 0 0 3 5 5 4 8 Key: 1 | 1 = 11

Slide 128 (Answer) / 188

60 What is the median of the stem-and-leaf plot? Stem Leaf 1 1 1 2 2 0 0 3 5 5 4 8 Key: 1 | 1 = 11

[This object is a pull tab]

Answer

20

Slide 129 / 188

61 What is the mode of the stem-and-leaf plot? Stem Leaf 1 1 1 2 2 0 0 3 5 5 4 8 Key: 1 | 1 = 11

slide-33
SLIDE 33

Slide 129 (Answer) / 188

61 What is the mode of the stem-and-leaf plot? Stem Leaf 1 1 1 2 2 0 0 3 5 5 4 8 Key: 1 | 1 = 11

[This object is a pull tab]

Answer

11 and 20

Slide 130 / 188

62 What is the mean of the stem-and-leaf plot? Stem Leaf 1 8 9 3 7 7 9 Key: 1 | 8 = 1.8

Slide 130 (Answer) / 188

62 What is the mean of the stem-and-leaf plot? Stem Leaf 1 8 9 3 7 7 9 Key: 1 | 8 = 1.8

[This object is a pull tab]

Answer

3

Slide 131 / 188

63 What is the median of the stem-and-leaf plot? Stem Leaf 1 8 9 3 7 7 9 Key: 1 | 8 = 1.8

Slide 131 (Answer) / 188

63 What is the median of the stem-and-leaf plot? Stem Leaf 1 8 9 3 7 7 9 Key: 1 | 8 = 1.8

[This object is a pull tab]

Answer

3.7

Slide 132 / 188

64 What is the mode of the stem-and-leaf plot? Stem Leaf 1 8 9 3 7 7 9 Key: 1 | 8 = 1.8

slide-34
SLIDE 34

Slide 132 (Answer) / 188

64 What is the mode of the stem-and-leaf plot? Stem Leaf 1 8 9 3 7 7 9 Key: 1 | 8 = 1.8

[This object is a pull tab]

Answer

3.7

Slide 133 / 188

Miss M's Math Class Scores

90 50 60 70 80 100

1st Period Scores

Measures of Center

Use the dot plots to find the measures of center.

Slide 133 (Answer) / 188

Miss M's Math Class Scores

90 50 60 70 80 100

1st Period Scores

Measures of Center

Use the dot plots to find the measures of center.

[This object is a pull tab]

Answer

Mean: about 80.417 Median: 80 Mode: 80

Slide 134 / 188

Miss M's Math Class Scores

90 50 60 70 80 100

8th Period Scores

Measures of Center

Use the dot plots to find the measures of center.

Slide 134 (Answer) / 188

Miss M's Math Class Scores

90 50 60 70 80 100

8th Period Scores

Measures of Center

Use the dot plots to find the measures of center.

[This object is a pull tab]

Answer

Mean: about 75.83 Median: 75 Mode: 75

Slide 135 / 188 Measures of Center

Write a statement comparing the averages of Miss M's 1st period class scores to her 8th period class scores.

slide-35
SLIDE 35

Slide 136 / 188

Measures of Variation

Return to Table of Contents

Slide 137 / 188 Measures of Variation - Vocabulary Review

Quartiles - are the values that divide the data in four equal parts. Lower (1st) Quartile (Q1) - The median of the lower half of the data. Upper (3rd) Quartile (Q3) - The median of the upper half of the data. Interquartile Range - The difference of the upper quartile and the lower quartile. (Q3 - Q1) Range - The difference between the greatest data value and the least data value.

Slide 138 / 188

1, 5, 8, 3, 2, 5, 2, 8, 9, 5 1, 2, 2, 3, 5, 5, 5, 8, 8, 9 · To find the interquartile range of the data set, we first have to find the quartiles. Step 1 : Order the numbers from least to greatest.

Interquartile Range Slide 139 / 188

1, 2, 2, 3, 5, 5, 5, 8, 8, 9 Step 2 : Find the median. 5 median *Note : · If the median falls in between two data values, all of the values are still used to calculate the upper and lower quartiles. · If the median falls exactly on one of the two data values, than that values is NOT used to calculate the upper and lower quartiles.

Interquartile Range Slide 140 / 188

1, 2, 2, 3, 5, 5, 5, 8, 8, 9

5 median 8 Upper 2 Lower Quartile Quartile

Step 3 : Find the upper and lower quartiles. Find the mean of each half of the data set.

Interquartile Range Slide 141 / 188

Upper Lower Quartile Quartile Step 4 : Subtract the lower quartile from the upper quartile. Interquartile = Range

  • 8
  • 2

= 6

Interquartile Range

slide-36
SLIDE 36

Slide 142 / 188

1, 2, 2, 3, 5, 5, 5, 8, 8, 9 · To find the range, subtract the least value from the greatest value. Greatest Least Value Value = Range

  • 9
  • 1

= 8

Sample Range Slide 143 / 188

1, 2, 2, 3, 5, 5, 5, 8, 8, 9

5 Median 8 Upper 2 Lower Quartile Quartile 1 Least Value 9 Greatest Value

Box-and-Whisker Plot

These 5 values are used to create a box-and-whisker

  • plot. To do this, plot all 5 values on the number line

and then connect them to look like a box with whiskers on both sides.

click just above the number line to reveal

1 2 3 4 5 6 7 8 9 10

Slide 144 / 188

65 What is the median of the data set?

1 2 3 4 5 6 7 8 9 10

Slide 144 (Answer) / 188

65 What is the median of the data set?

1 2 3 4 5 6 7 8 9 10

[This object is a pull tab]

Answer

4

Slide 145 / 188

66 What is the interquartile range using the given information? Least Value = 3 Lower Quartile = 6 Median = 7 Upper Quartile = 10 Greatest Value = 11

Slide 145 (Answer) / 188

66 What is the interquartile range using the given information? Least Value = 3 Lower Quartile = 6 Median = 7 Upper Quartile = 10 Greatest Value = 11

[This object is a pull tab]

Answer

4

slide-37
SLIDE 37

Slide 146 / 188

67 What is the range for the following data set? 3, 5, 10, 4, 2, 2, 1

Slide 146 (Answer) / 188

67 What is the range for the following data set? 3, 5, 10, 4, 2, 2, 1

[This object is a pull tab]

Answer

9

Slide 147 / 188

68 What is the interquartile range for the following data set? 3, 5, 10, 4, 2, 2, 1

Slide 147 (Answer) / 188

68 What is the interquartile range for the following data set? 3, 5, 10, 4, 2, 2, 1

[This object is a pull tab]

Answer

3

Slide 148 / 188

Mean Absolute Deviation

Return to Table of Contents

Slide 149 / 188

Mean absolute deviation

  • the average distance between each

data value and the mean.

Mean Absolute Deviation - Vocabulary

slide-38
SLIDE 38

Slide 150 / 188 Mean Absolute Deviation

Find the mean absolute deviation of the following data. Quiz Scores 65, 75, 90, 90, 100 Step 1: Find the mean. 65 + 75 + 90 + 90 + 100 = 420 = 84 5 5

Slide 151 / 188 Score Deviation from mean Absolute deviation from mean 65 65 - 84 = -19 |-19| = 19 75 75 - 84 = -9 |-9| = 9 90 90 - 84 = 6 |6| = 6 90 90 - 84 = 6 |6| = 6 100 100 - 84 = 16 |16| = 16

Step 2: Find the absolute deviation. To do this you need to subtract the mean and each data point. Then take the absolute value of each difference.

Mean Absolute Deviation Slide 152 / 188 Absolute deviation from mean |-19| = 19 |-9| = 9 |6| = 6 |6| = 6 |16| = 16 Mean Absolute Deviation

Step 3: Find the mean absolute deviation (MAD). To do this find the mean using the absolute deviation numbers. 19 + 9 + 6 + 6 + 16 5 = 56 = 11.2 5 The MAD is 11.2 points. Answer

Slide 153 / 188

5 6 4 3 2 1 7 8 9 10 5 6 4 3 2 1 7 8 9 10

Girls' Team Boys' Team

Comparing Two Data Sets

The number of goals scored by the players on the boys' and girls' LAX teams are displayed below. Compare the variability of the mean goals scored for both teams.

Slide 154 / 188

5 6 4 3 2 1 7 8 9 10

Girls' Team

5 6 4 3 2 1 7 8 9 10

Boys' Team

Comparing Two Data Sets

Step 1: Find the mean for each team.

Slide 154 (Answer) / 188

5 6 4 3 2 1 7 8 9 10

Girls' Team

5 6 4 3 2 1 7 8 9 10

Boys' Team

Comparing Two Data Sets

Step 1: Find the mean for each team.

[This object is a pull tab]

Answer

= 48 = 6 8 2 + 5 + 6 + 6 + 6 + 7 + 8 + 8 8 Boys' Team Mean = 40 = 5 8 3 + 3 + 4 + 5 + 5 + 5 + 5 + 10 8 Girls' Team Mean

slide-39
SLIDE 39

Slide 155 / 188

Goals Mean Deviation Absolute Mean Dev. Goals Mean Deviation Absolute Mean Dev.

Girls' Team Boys' Team

Comparing Two Data Sets

Step 2: Find the absolute deviations.

Slide 156 / 188

Girls' Team Boys' Team

Comparing Two Data Sets

Step 3: Find the mean absolute deviations.

Slide 156 (Answer) / 188

Girls' Team Boys' Team

Comparing Two Data Sets

Step 3: Find the mean absolute deviations.

[This object is a pull tab]

Answer

= 10 = 1.25 8 2 + 2 + 1 + 0 + 0 + 0 + 0 + 5 8 Girls' Team MAD = 10 = 1.25 8 4 + 1 + 0 + 0 + 0 + 1 + 2 + 2 8 Boys' Team MAD

Slide 157 / 188 Comparing Two Data Sets

Comparison Statements 1.25 = 1.25 The variability is equal for both the boys and girls LAX teams. On average, the boy players scored 1 more goal than the girl players. (How do you know this?)

Slide 157 (Answer) / 188 Comparing Two Data Sets

Comparison Statements 1.25 = 1.25 The variability is equal for both the boys and girls LAX teams. On average, the boy players scored 1 more goal than the girl players. (How do you know this?)

[This object is a pull tab]

Answer

Remember when comparing averages, look at the means. Girls = 5 goals Boys = 6 goals

Slide 158 / 188

Pages per Chapter in Hunger Games 10 15 20 25 30

x x x x x x x x x x x x x x x x x x x x x x x x x x x

10 15 20 25 30

x x x x x x x x x x x x x x x x x x x x x x

Pages per Chapter in Twilight Use the following data to answer the next seven questions.

Comparing Two Data Sets

slide-40
SLIDE 40

Slide 159 / 188

69 What is the mean number of pages per chapter in the Hunger Games?

Slide 159 (Answer) / 188

69 What is the mean number of pages per chapter in the Hunger Games?

[This object is a pull tab]

Answer

13.63 pages

Slide 160 / 188

70 What is the mean number of pages per chapter in Twilight?

Slide 160 (Answer) / 188

70 What is the mean number of pages per chapter in Twilight?

[This object is a pull tab]

Answer

20.41 pages

Slide 161 / 188

71 What is the difference of the means?

Slide 161 (Answer) / 188

71 What is the difference of the means?

[This object is a pull tab]

Answer

6.78

slide-41
SLIDE 41

Slide 162 / 188

72 What is the mean absolute deviation of the data set for Hunger Games? (Hint: Round mean to the nearest ones.)

Slide 162 (Answer) / 188

72 What is the mean absolute deviation of the data set for Hunger Games? (Hint: Round mean to the nearest ones.)

[This object is a pull tab]

Answer

1.78

Slide 163 / 188

73 What is the mean absolute deviation of the data set for Twilight? (Hint: Round mean to the nearest ones.)

Slide 163 (Answer) / 188

73 What is the mean absolute deviation of the data set for Twilight? (Hint: Round mean to the nearest ones.)

[This object is a pull tab]

Answer

4.32

Slide 164 / 188

74 Which book has more variability in the number of pages per chapter? A Hunger Games B Twilight

Slide 164 (Answer) / 188

74 Which book has more variability in the number of pages per chapter? A Hunger Games B Twilight

[This object is a pull tab]

Answer

B

slide-42
SLIDE 42

Slide 165 / 188

75 On average, there are ______ pages per chapter in the Hunger Games than in Twilight. A more B less

Slide 165 (Answer) / 188

75 On average, there are ______ pages per chapter in the Hunger Games than in Twilight. A more B less

[This object is a pull tab]

Answer

B less

Slide 166 / 188

Glossary

Return to Table of Contents

Slide 166 (Answer) / 188

Glossary

Return to Table of Contents

[This object is a pull tab]

Teacher Notes

Vocabulary Words are bolded in the presentation. The text box the word is in is then linked to the page at the end

  • f the presentation with the

word defined on it.

Slide 167 / 188

Back to Instruction

Biased Sample

When every possible sample of the same size does not have an equal chance of being selected.

Asking only flight attendants if they believe flying is safe. Asking everyone in Hershey Park if they like chocolate. Asking everyone at ComicCon if they like comic books.

Slide 168 / 188

Back to Instruction

Capture-Recapture Method

A method of sampling that is used to try and estimate the entire

  • population. A sample of animals are caught, tagged, and then

released into the wild. Later a second sample of animals are caught to compute using a ratio the amount of tagged animals to the population as a whole.

slide-43
SLIDE 43

Slide 169 / 188

Back to Instruction

Compound Event

A combination of two or more simple events.

The prob. of flipping heads AND rolling 4 on a die. The prob. of selecting a Jack OR a 3 card. The prob. of selecting a Jack AND a 3 card.

Slide 170 / 188

Back to Instruction

Dependent Event

When the outcome of one affects the

  • utcome of another event.

Probability (A & B) = Prob(A) *Prob(B given A) The prob. of selecting a Jack AND a 3 card.

Slide 171 / 188

Back to Instruction

Equally Likely

When all the outcomes have the same chance of occurring.

Sides on a Coin

A Fair Die A Fair Spinner Slide 172 / 188

Back to Instruction

Experimental Probability

The ratio of the number of times an event occurs to the total number of times that the activity is performed.

number of times the outcome happened number of times experiment was repeated

Probability

  • f an event

Last week, 24 out

  • f 124 golfers hit a

hole-in-one on the last hole. Find the experimental probability that a golfer makes this shot.

P(hole-in-one) = # of successes = # of trials 24 124 = 6 31

Slide 173 / 188

Back to Instruction

Fair

An experiment with equally likely

  • utcomes.

Tossing a Coin Rolling a Fair Die Spinning a Fair Spinner

Slide 174 / 188

Back to Instruction

Independent Event

When the outcome of one event does not affect the outcome of another event.

Probability (A and B) = Prob(A)Prob(B) The prob. of flipping heads AND rolling 4 on a die.

slide-44
SLIDE 44

Slide 175 / 188

Back to Instruction

Interquartile Range

The difference of the upper quartile and the lower quartile.

25% 25%

25% 25%

Q1 Q2 Q3

1,3,3,4,5,6,6,7,8,8

Q1 Q2 Q3

1 2 3 4 5 6 7 8

Q1

Q2 Q3

= Q3 - Q1 = Q3 - Q1 = 4 Slide 176 / 188

Back to Instruction

Lower (1st) Quartile

The median of the lower half of data.

25% 25%

25% 25%

Q1 Q2 Q3

1,3,3,4,5,6,6,7,8,8

Q1 Q2 Q3

1 2 3 4 5 6 7 8

Q1

Q2 Q3

Median

}

Median

}

Slide 177 / 188

Back to Instruction

Mean

Average The sum of the data values divided by the number of items.

1, 2, 3, 4, 5

Set of Data:

1+2+3+4+5 =15 15/5 = 3

The mean is 3. Slide 178 / 188

Back to Instruction

Mean Absolute Deviation

The average distance between each data value and the mean.

Find the mean Subtract the mean from each data point Find the mean of the differences

2,2,3,4,4

15 5=3

3-2=1 4-3=1 3-3=0

1+1+0+1+1 =4 5=.8

3-2=1 4-3=1

1. 2. 3. Slide 179 / 188

Back to Instruction

Median

The middle data value when the values are written in numerical order.

1, 2, 3, 4, 5

Median

1, 2, 3, 4

Median is 2.5

1+2+3+4 = 10 10/4 = 2.5 Slide 180 / 188

Back to Instruction

Mode

The data value that occurs the most often. 2, 4, 6, 3, 4

The mode is 4.

2, 4, 6, 2, 4

The mode is 4 and 2.

2, 4, 6, 3, 8

There is no mode.

slide-45
SLIDE 45

Slide 181 / 188

Back to Instruction

Population

A whole group.

Population Sample

· All m&ms in a bag · All types of dogs in a dog park · All students wearing glasses in a classroom

NOT just people in a place

Slide 182 / 188

Back to Instruction What is the probability

  • f flipping a nickel and

the nickel landing on heads?

1 favorable 2 possible

Probability

The ratio of the number of favorable

  • utcomes to the total number of

possible outcomes.

Number of favorable outcomes Total number of possible outcomes

Probability

  • f an event

P(event)

=

1 or 50% 2 1:2 or 0.5 Many Forms!

Slide 183 / 188

Back to Instruction

Quartiles

The values that divide the data in four equal parts.

25% 25%

25% 25%

Q1 Q2

Q3 1,3,3,4,5,6,6,7,8,8

Q1 Q2

Q3

1 2 3 4 5 6 7 8

Q1

Q2 Q3

Slide 184 / 188

Back to Instruction

Random Sample

Unbiased - Every possible sample of the same size has an equal chance of being selected

Asking everyone in a classroom if they believe flying is safe. Asking everyone in a classroom if they like chocolate. Asking everyone in a classroom if they like comic books.

Slide 185 / 188

Back to Instruction

Range

The difference between the greatest data value and the least data value. 2, 4, 7, 12 12 - 2 = 10

The range is 10.

5, 9, 10, 40 40 - 5 = 35

The range is 35.

1, 5, 9, 18 18 - 1 = 17

The range is 17.

Slide 186 / 188

Back to Instruction

Sample

A part of a group.

Population Sample

random

  • r

unbiased

·

  • nly red m&ms

in a bag ·

  • nly poodles in a dog

park ·

  • nly girls wearing

glasses in a classroom

slide-46
SLIDE 46

Slide 187 / 188

Back to Instruction

Theoretical Probability

The ratio of the number of equally likely

  • utcomes in an event to the total number of

possible outcomes.

number of favorable outcomes total number of possible outcomes

Probability

  • f an event

Find the probability of getting tails when you flip a coin.

P(tails) =

# of favorable

  • utcomes

# of possible

  • utcomes

1 2 =

Slide 188 / 188

Back to Instruction

Upper Quartile

The median of the upper half of data.

25% 25%

25% 25%

Q1 Q2

Q3 1,3,3,4,5,6,6,7,8,8

Q1 Q2 Q3

1 2 3 4 5 6 7 8

Q1

Q2 Q3

Median

}

Median

}