
SLIDE 1
Introduction to Machine Learning Evaluation: Test Error
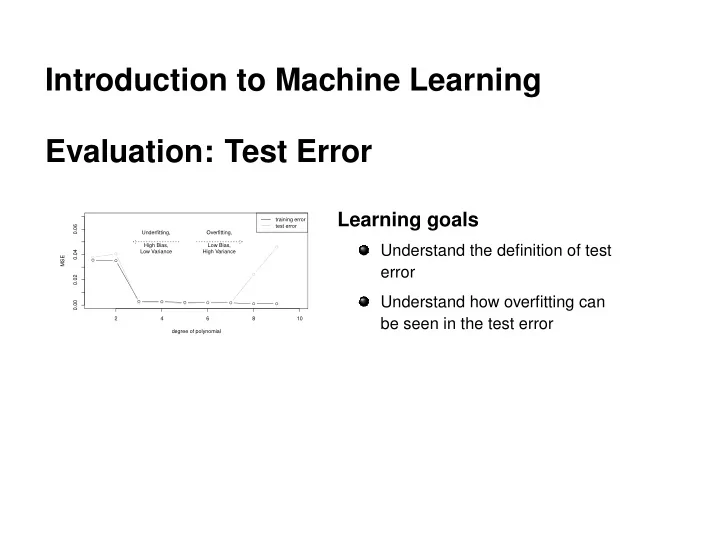
2 4 6 8 10 0.00 0.02 0.04 0.06 degree of polynomial MSE training error test error Underfitting, High Bias, Low Variance Overfitting, Low Bias, High Variance
Introduction to Machine Learning Evaluation: Test Error Learning - - PowerPoint PPT Presentation
Introduction to Machine Learning Evaluation: Test Error Learning goals training error 0.06 test error Underfitting, Overfitting, High Bias, Low Bias, Understand the definition of test 0.04 Low Variance High Variance MSE error 0.02
2 4 6 8 10 0.00 0.02 0.04 0.06 degree of polynomial MSE training error test error Underfitting, High Bias, Low Variance Overfitting, Low Bias, High Variance
c
Learner Fit
Predict
Training Dataset Test Dataset
Split into Tain and Test
c
0.00 0.25 0.50 0.75 1.00 0.00 0.25 0.50 0.75 1.00
x y
Train set Test set True function
d
c
0.00 0.25 0.50 0.75 1.00 0.00 0.25 0.50 0.75 1.00
x y degree
1 3 9 Train set Test set True function
c
2 4 6 8 10 0.00 0.02 0.04 0.06 degree of polynomial MSE training error test error Underfitting, High Bias, Low Variance Overfitting, Low Bias, High Variance
c
c
c