
SLIDE 1
Introduction to Machine Learning CART: Growing a Tree
Petal.Length < 2.5 yes no
1 2 3
Petal.Length < 2.5 setosa .33 .33 .33 100% setosa 1.00 .00 .00 33% versicolor .00 .50 .50 67% yes no
1 2 3
Introduction to Machine Learning CART: Growing a Tree Learning - - PowerPoint PPT Presentation
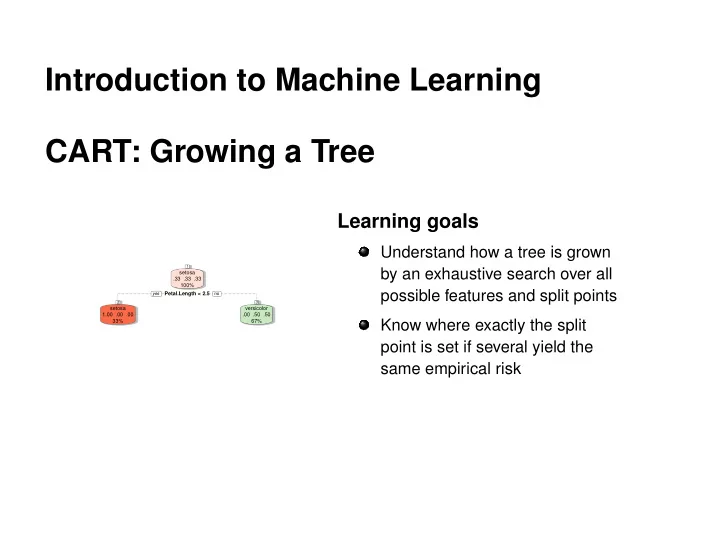
Introduction to Machine Learning CART: Growing a Tree Learning goals Understand how a tree is grown 1 1 by an exhaustive search over all setosa .33 .33 .33 100% possible features and split points Petal.Length < 2.5 Petal.Length <
Petal.Length < 2.5 yes no
1 2 3
Petal.Length < 2.5 setosa .33 .33 .33 100% setosa 1.00 .00 .00 33% versicolor .00 .50 .50 67% yes no
1 2 3
c
0.0 0.5 1.0 1.5 2.0 2.5 2 4 6
Petal.Length Petal.Width Response
setosa versicolor virginica
Iris Data
Petal.Length < 2.5
yes no
1 2 3
Petal.Length < 2.5 setosa .33 .33 .33 100% setosa 1.00 .00 .00 33% versicolor .00 .50 .50 67%
yes no
1 2 3
c
0.0 0.5 1.0 1.5 2.0 2.5 2 4 6
Petal.Length Petal.Width Response
setosa versicolor virginica
Iris Data
Petal.Length < 2.5 Petal.Width < 1.8
yes no
1 2 3 6 7
Petal.Length < 2.5 Petal.Width < 1.8 setosa .33 .33 .33 100% setosa 1.00 .00 .00 33% versicolor .00 .50 .50 67% versicolor .00 .91 .09 36% virginica .00 .02 .98 31%
yes no
1 2 3 6 7
c
0.0 0.5 1.0 1.5 2.0 2.5 2 4 6
Petal.Length Petal.Width Response
setosa versicolor virginica
Iris Data
Petal.Length < 2.5 Petal.Width < 1.8 Petal.Length < 5
yes no
1 2 3 6 12 13 7
Petal.Length < 2.5 Petal.Width < 1.8 Petal.Length < 5 setosa .33 .33 .33 100% setosa 1.00 .00 .00 33% versicolor .00 .50 .50 67% versicolor .00 .91 .09 36% versicolor .00 .98 .02 32% virginica .00 .33 .67 4% virginica .00 .02 .98 31%
yes no
1 2 3 6 12 13 7
c
2.0 2.5 3.0 3.5 5.0 5.5 6.0 6.5 7.0
Sepal.Length Sepal.Width
c