introduction robustness assessment for composite
play

Introduction Robustness Assessment for Composite Indicators - PowerPoint PPT Presentation

Introduction Robustness Assessment for Composite Indicators Objectives of Sensitivity Analysis (examples): Help identify key sources of variability (to assist policy making, risk management strategy) Luis Huergo 1 Michaela Saisana 2 Help


  1. Introduction Robustness Assessment for Composite Indicators Objectives of Sensitivity Analysis (examples): ◮ Help identify key sources of variability (to assist policy making, risk management strategy) Luis Huergo 1 Michaela Saisana 2 ◮ Help identify key sources of uncertainty (to prioritize additional data collection to reduce uncertainty) ◮ Variance of an output 1 University of Tuebingen, Germany ◮ What causes worst/best outcomes (luis.huergo@uni-tuebingen.de) ◮ What are critical control points, critical limits 2 European Commission Local vs. Global Sensitivity Analysis Joint Research Centre Ispra, Italy Model Dependent vs. Model Independent Sensitivity Analysis (michaela.saisana@jrc.it) Applicability of methods often depends upon characteristics of a 16 th June 2006 model (e.g., nonlinear, thresholds, categorical inputs, etc.) 16 th June 2006 16 th June 2006 Luis Huergo, Michaela Saisana Robustness Assessment for Composite Indicators 1 / 13 Luis Huergo, Michaela Saisana Robustness Assessment for Composite Indicators 2 / 13 
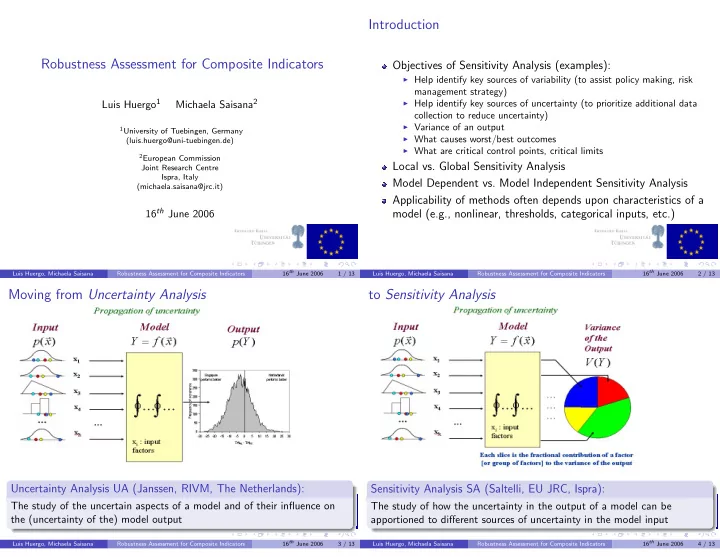
Moving from Uncertainty Analysis to Sensitivity Analysis Uncertainty Analysis UA (Janssen, RIVM, The Netherlands): Sensitivity Analysis SA (Saltelli, EU JRC, Ispra): The study of the uncertain aspects of a model and of their influence on The study of how the uncertainty in the output of a model can be the (uncertainty of the) model output apportioned to different sources of uncertainty in the model input 16 th June 2006 16 th June 2006 Luis Huergo, Michaela Saisana Robustness Assessment for Composite Indicators 3 / 13 Luis Huergo, Michaela Saisana Robustness Assessment for Composite Indicators 4 / 13

  2. Ideal SA Method Sobol’ Sensitivity Measures First-order Sensitivity Measure ( S i ) Cope with scale and shape of the input factors: Range of the factor Measures the fractional contribution of x i to the variance of f ( x ) without variation and shape / parameters of the pdf. accounting for interactions of x i with the other factors. Include multi-dimensional averaging: Global versus local methods � � S i ≡ V x i E x − i ( Y | x i ) Model independent (model free): Cope with non-linear / non-additive, V Y non-monotonic models Grouping of factors: Treat grouped factors as if they were single factors Total-order Sensitivity Measure ( TS i ) Cost efficient Pay attention to computational costs C The sum of all the sensitivity measures involving the factor in question. SA types e.g. for a model with three input factors, TS 1 = S 1 + S 12 + S 13 + S 123 . Local or global TS i ≡ E x − i ( V x i ( Y | x − i )) Qualitative or quantitative V Y 16 th June 2006 16 th June 2006 Luis Huergo, Michaela Saisana Robustness Assessment for Composite Indicators 5 / 13 Luis Huergo, Michaela Saisana Robustness Assessment for Composite Indicators 6 / 13 Sobol’ LP τ sampling 2002 Knowledge Economy Index Each Sensitivity Measure is a quotient of integrals in a multidimensional space, which can be approximated via MC integration. For large or computer-intensive models it is important that the integral be approximated with as few model evaluations as possible. The LP τ sequences have the property of always generating points which are regularly distributed in the factor space. 16 th June 2006 16 th June 2006 Luis Huergo, Michaela Saisana Robustness Assessment for Composite Indicators 7 / 13 Luis Huergo, Michaela Saisana Robustness Assessment for Composite Indicators 8 / 13

  3. Acknowledging assumptions in the development of the Uncertainty analysis results Index 1 Selecting Indicators Inclusion- Exclusion of one indicator-at-a-time 2 Imputation Trend model: least squares polynomial regression + t-test for the estimates of the std for regression coefficients 3 Weighting Equal weights 1 Conceptual model 2 Country-specific weights 3 Investing in the Knowledge Economy (EU-15): 4 Aggregation AT has a 35% probability to be among the top 5 countries and 0% Linear 1 probability to be among the bottom 5 countries Geometric 2 16 th June 2006 16 th June 2006 Luis Huergo, Michaela Saisana Robustness Assessment for Composite Indicators 9 / 13 Luis Huergo, Michaela Saisana Robustness Assessment for Composite Indicators 10 / 13 Sensitivity analysis results (Sobol’ method) Sensitivity analysis as a tool to identify thresholds Selected countries rank versus two important imputed values: PhD FR ∼ N (6428,476) TES UK ∼ N (4.52,0.17) Regardless of the changes in the other factors (imputed va- lues, aggregation, weighting, set of indicators) . . . France will not fall behind the 6 th position if the expected number of PhD First order: Capture individual impact students is 7200. Total effect: Capture interactions/synergies UK will not fall behind the 8 th position if the expected value for TES = 4 . 52 % is the correct one. 16 th June 2006 16 th June 2006 Luis Huergo, Michaela Saisana Robustness Assessment for Composite Indicators 11 / 13 Luis Huergo, Michaela Saisana Robustness Assessment for Composite Indicators 12 / 13

  4. Further reading JRC Information Server on Composite Indicators at http://farmweb.jrc.cec.eu.int/ci/ Nardo M., Saisana M., Saltelli A. and Tarantola S. (2005) Tools for Composite Indicators Building, EUR 21682, European Commission. Nardo M., M. Saisana, A. Saltelli and S. Tarantola, A. Hoffman and E. Giovannini (2005) Handbook on Constructing Composite Indicators: Methodology and User Guide OECD Statistics Working Paper JT00188147, STD / DOC(2005)3.http: // www.olis.oecd.org / olis / 2005doc.nsf / LinkTo / std-doc(2005)3 Saisana M., Saltelli A., Tarantola S., 2005, Uncertainty and Sensitivity analysis techniques as tools for the quality assessment of composite indicators, J. R. Stat. Soc. A, 168(2), 307:323. Saltelli A. (2002), Making best use of model valuations to compute sensitivity indices, Comput. Phys. Commu. 145, 280:97. Saltelli, A., Chan, K. and Scott, M. (2000), Sensitivity analysis, Probability and Statistics series, New York: John Wiley and Sons. Sobol’ IM (1967), On the distribution of points in a cube and the approximate evaluation of integrals, USSR Comput. Math. Phys. 7, 86:112. 16 th June 2006 Luis Huergo, Michaela Saisana Robustness Assessment for Composite Indicators 13 / 13

Download Presentation
Download Policy: The content available on the website is offered to you 'AS IS' for your personal information and use only. It cannot be commercialized, licensed, or distributed on other websites without prior consent from the author. To download a presentation, simply click this link. If you encounter any difficulties during the download process, it's possible that the publisher has removed the file from their server.

Recommend


More recommend