
13/10/2011 1
REMASCO Proposal Kingsville
Introduction
Considered:
Existing Conditions
Ambient air quality data Local sources
Emission Test Data from REMASCO
Modelled Existing and REMASCO sources to:
Determine Cumulative Effects of Project Point of Impingement Results for REMASCO
Compared POI values to Standards Transferred results to Human Health Risk Assessment
Existing Air Quality
Southwestern Ontario under influence of trans‐ boundary flow of contaminants results in elevated levels of ozone [O3], fine particulate [PM2.5], oxides of nitrogen [NOx] Local sources: building heating; power generation; vehicles; and, industrial processes also contribute to Air Quality conditions Ministry of Environment [MoE] monitors
O3, PM2.5, NOx in Windsor and Chatham O3 and PM2.5 in Port Stanley
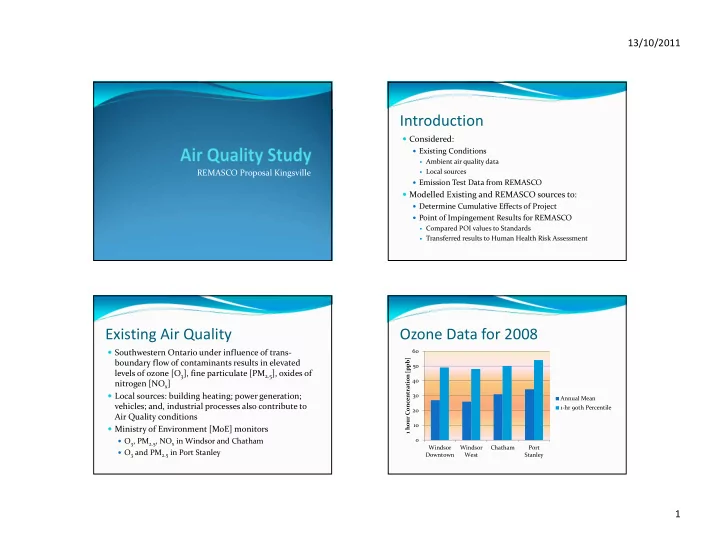
Ozone Data for 2008
10 20 30 40 50 60 Windsor Downtown Windsor West Chatham Port Stanley 1 hour Concentration [ppb] Annual Mean 1‐hr 90th Percentile