SLIDE 1 Experimental Verification of a Peak Limiting Current Mode Controlled Switching Cell Model
Marija Glišić and Predrag Pejović
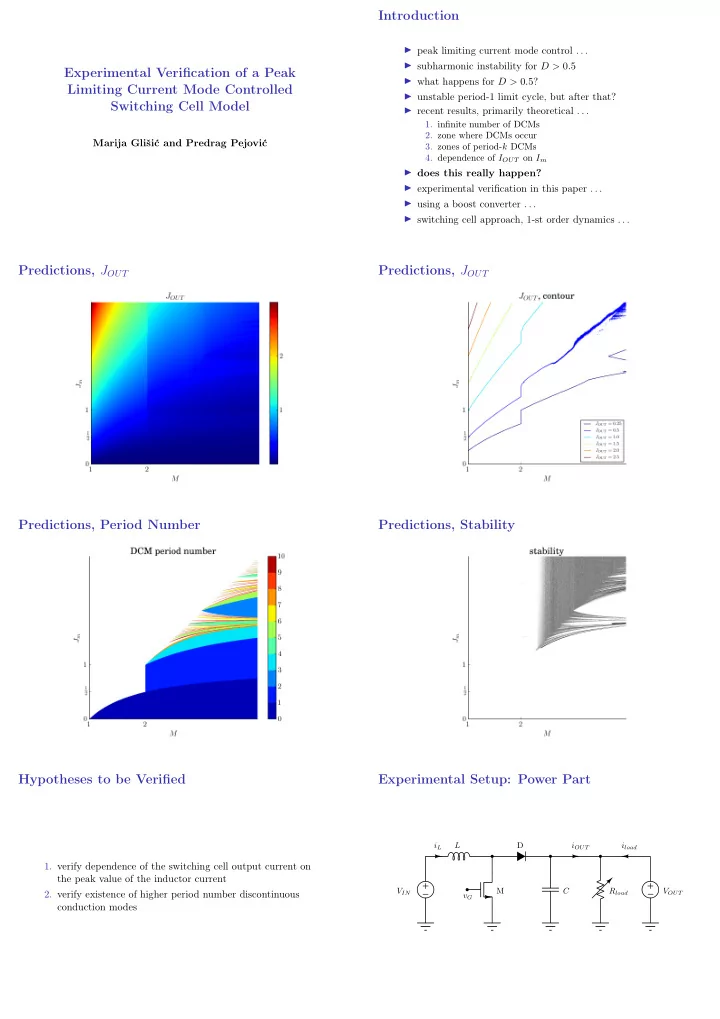
Introduction
◮ peak limiting current mode control . . . ◮ subharmonic instability for D > 0.5 ◮ what happens for D > 0.5? ◮ unstable period-1 limit cycle, but after that? ◮ recent results, primarily theoretical . . .
- 1. infinite number of DCMs
- 2. zone where DCMs occur
- 3. zones of period-k DCMs
- 4. dependence of IOUT on Im
◮ does this really happen? ◮ experimental verification in this paper . . . ◮ using a boost converter . . . ◮ switching cell approach, 1-st order dynamics . . .
Predictions, JOUT Predictions, JOUT Predictions, Period Number Predictions, Stability Hypotheses to be Verified
- 1. verify dependence of the switching cell output current on
the peak value of the inductor current
- 2. verify existence of higher period number discontinuous
conduction modes
Experimental Setup: Power Part
+ − + −
L VIN VOUT M D iL Rload C iOUT iload vG
SLIDE 2 Experimental Setup: Power Part
◮ VIN = 5 V ◮ VOUT either 12 V, 17 V, 24 V, or 29 V. ◮ 0 < Im ≤ 2.5 A in 5000 data points ◮ Keysight 34461A to measure IOUT ◮ Tektronix TBS 1052B-EDU to record waveforms ◮ Keysight 33500B to provide the clock ◮ Agilent 33220A to assign Im ◮ Python to automate the measurements . . . ◮ IRF1010N MOSFET ◮ 1N5819 diode ◮ L ≈ 1 mH
Experimental Setup: Control Part
− + − + − +
+12 V +12 V +12 V vCP Vm vclock vG 20 kΩ 1 kΩ 1 kΩ 1 kΩ 1 kΩ 10 kΩ 10 kΩ LF351 LM311 LM311 BC327 BC337
Output Current, VOUT = 12 V
0.00 0.25 0.50 0.75 1.00 1.25 1.50 1.75 2.00 2.25 2.50 Im [A] 0.0 0.1 0.2 0.3 0.4 0.5 0.6 0.7 IOUT [A]
VOUT = 12 V
analytical experimental
Output Current, VOUT = 17 V
0.00 0.25 0.50 0.75 1.00 1.25 1.50 1.75 2.00 2.25 2.50 Im [A] 0.0 0.1 0.2 0.3 0.4 0.5 IOUT [A]
VOUT = 17 V
analytical experimental
Output Current, VOUT = 24 V
0.00 0.25 0.50 0.75 1.00 1.25 1.50 1.75 2.00 2.25 2.50 Im [A] 0.00 0.05 0.10 0.15 0.20 0.25 0.30 0.35 0.40 IOUT [A]
VOUT = 24 V
analytical experimental
Output Current, VOUT = 29 V
0.00 0.25 0.50 0.75 1.00 1.25 1.50 1.75 2.00 2.25 2.50 Im [A] 0.00 0.05 0.10 0.15 0.20 0.25 0.30 0.35 0.40 IOUT [A]
VOUT = 29 V
analytical experimental
Period-1 Operation
VIN = 5 V, VOUT = 17 V, Im = 237.82 mA
Period-2 Operation
VIN = 5 V, VOUT = 17 V, Im = 488.60 mA
SLIDE 3
Period-2 Operation
VIN = 5 V, VOUT = 17 V, Im = 732.67 mA
Period-3 Operation
VIN = 5 V, VOUT = 17 V, Im = 1115.09 mA
Period-4 Operation
VIN = 5 V, VOUT = 17 V, Im = 888.81 mA
Period-4 Operation
VIN = 5 V, VOUT = 17 V, Im = 998.35 mA
Period-5 Operation
VIN = 5 V, VOUT = 17 V, Im = 975.29 mA
Period-6 Operation
VIN = 5 V, VOUT = 17 V, Im = 1010.36 mA
Period-7 Operation
VIN = 5 V, VOUT = 17 V, Im = 1026.21 mA
Period-8 Operation
VIN = 5 V, VOUT = 17 V, Im = 1358.67 mA
SLIDE 4
Period-9 Operation
VIN = 5 V, VOUT = 17 V, Im = 1065.13 mA
Period-13 Operation
VIN = 5 V, VOUT = 17 V, Im = 1009.40 mA
Conclusions
◮ switching cell model of peak limiting current mode control verified ◮ boost converter switching cell built ◮ an automated measurement system arranged ◮ IOUT (Im) measured for four output voltage values ◮ good agreement with theoretical predictions! ◮ higher order discontinuous conduction modes recorded . . . ◮ . . . up to 13-th order! ◮ significantly improved experimental verification ◮ the theory corresponds to actual processes . . . ◮ experimental verification successful!