Interpreting with Functions Comparing Different Representations of - - PDF document

interpreting with functions
SMART_READER_LITE
LIVE PREVIEW

Interpreting with Functions Comparing Different Representations of - - PDF document

Slide 1 / 122 Slide 2 / 122 8th Grade Modeling Relationships 2015-11-30 www.njctl.org Slide 3 / 122 Slide 4 / 122 Table of Contents Click on the topic to go to that section Interpreting with Functions Analyzing a Graph Interpreting with


slide-1
SLIDE 1

Slide 1 / 122 Slide 2 / 122

8th Grade

Modeling Relationships

2015-11-30 www.njctl.org

Slide 3 / 122 Table of Contents

Interpreting with Functions Analyzing a Graph Comparing Different Representations of Functions Glossary

Click on the topic to go to that section

Slide 4 / 122

Interpreting with Functions

Return to Table

  • f Contents

Slide 5 / 122

Any function can be written as a table, graph, verbal model, or equation. We can find the rate of change and the y-intercept from any of these representations. Remember, to find slope we can use the formula: To find the y-intercept (initial value) we look to where x = 0 y2 - y1 x2 - x1 Slope =

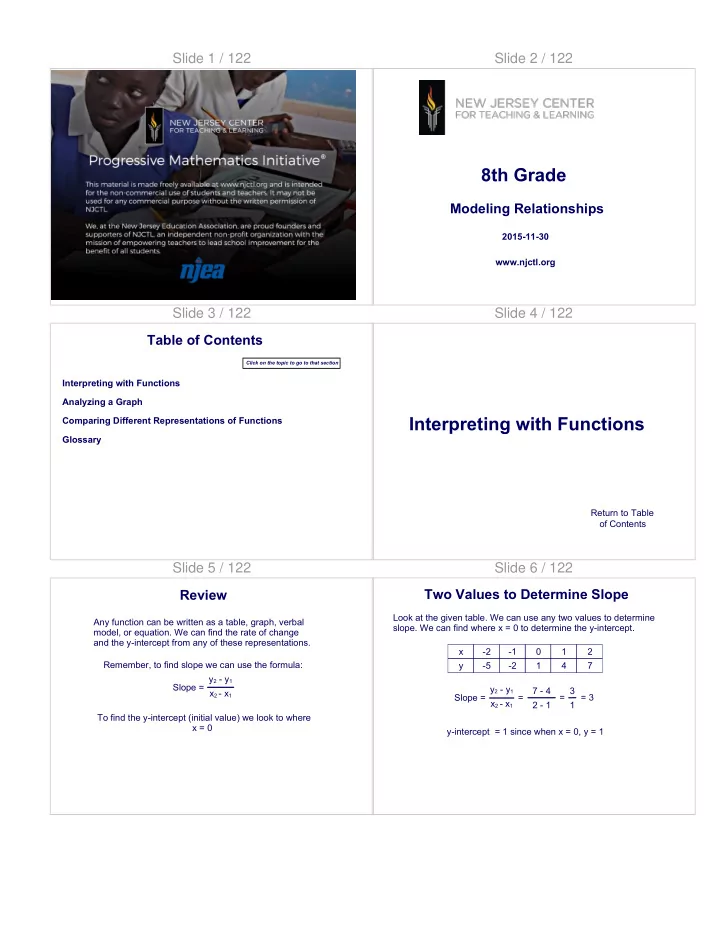
Review Slide 6 / 122

x

  • 2
  • 1

1 2 y

  • 5
  • 2

1 4 7 Slope = y2 - y1 x2 - x1 7 - 4 2 - 1 = 3 1 = = 3 y-intercept = 1 since when x = 0, y = 1 Look at the given table. We can use any two values to determine

  • slope. We can find where x = 0 to determine the y-intercept.

Two Values to Determine Slope

slide-2
SLIDE 2

Slide 7 / 122

Sometimes a table will not show the x-coordinate of zero. In that case you need to figure it out. There are a few ways to do it. x 1 2 3 4 5 6 7 y

  • 1

2 5 8 11 14 17 y = 3x - 4 There are two ways to find the y-intercept here.

Two Ways to Find y-Intercept Slide 8 / 122

y = 3x - 4 +3 +3 +3

  • 3

x 1 2 3 4 5 6 7 y

  • 4
  • 1

2 5 8 11 14 17 We can simply continue the table so that we can find y when x = 0. We see that the y's are moving at intervals of +3. In order to work backwards to where x = 0 we need to subtract 3 from y.

  • 3 - (-1) = -4 so when x = 0, y = -4.

Note: This technique works best when the table is close to x = 0

Continue the Table Slide 9 / 122

y = 3x - 4 x 1 2 3 4 5 6 7 y

  • 1

2 5 8 11 14 17 Another technique would be to substitute for x and solve for y using the equation. y = 3x - 4 y = 3(0) - 4 y = 0 - 4 y = -4 Note: This technique only works if you have the equation.

Substitute for X Slide 10 / 122

1 What is the slope of the following table?

x y

  • 2 -1
  • 1

1 3 1 5 2 7 3 9

Answer

Slide 11 / 122

2 What is the y-intercept of the following table? x y

  • 2
  • 1
  • 1

1 3 1 5 2 7 3 9

Answer

Slide 12 / 122

3 What is the slope of this table? x y 10 4 11 5 12 6 13 7 14 8

Answer

slide-3
SLIDE 3

Slide 13 / 122

4 What is the y-intercept of this table? x y 10 4 11 5 12 6 13 7 14 8 y = x - 6

Answer

Slide 14 / 122

5 What is the y-intercept of this table? x y 3 7 4 9 5 11 6 13 7 15

Answer

Slide 15 / 122

Carla puts away a certain amount of money per week. She started out with a certain amount. How could we figure out what she started out with and what she puts in per week? week 1 2 3 4 5 6 amount in account 74 82 90 98 106 114 122

How Much Per Week? Slide 16 / 122

week of saving 1 2 3 4 5 6 amount in account 74 82 90 98 106 114 122 If we look at the slope or rate of change we can figure out how much she puts in each week. So what is the slope of this table?

What is the Slope?

Answer

Slide 17 / 122

week of saving 1 2 3 4 5 6 amount in account 74 82 90 98 106 114 122 If we look at the initial value or y-intercept we can figure out how much Carla started with because the y-intercept is where Carla started without any weeks of savings. What is the initial value?

What is the Initial Value?

Answer

Slide 18 / 122 Try one.

Weeks since training began 2 3 4 5 6 7 Miles 7 10 13 16 19 22 Rob is training for a marathon. He is increasing his run each

  • week. Based on the table:

How much more will he run each week? How many miles was he running before training? How many weeks until he runs a full marathon 26.2 miles?

slide-4
SLIDE 4

Slide 19 / 122 Look at the Given Scenario.

Luke wants to buy cookies online for $12 per box with a flat fee for shipping and handling of $4.00. # of boxes price 1 16 2 20 3 24 4 28 5 32 Notice in this scenario that the initial value would be $4.00. However, in a real-life scenario,

  • ne does not pay for shipping and

handling if nothing is being

  • bought. BE CAREFUL with your

interpretation so that it makes sense with the scenario.

Slide 20 / 122

6 Evan is buying pizza from a store that sells each pie for a given price and each topping for set price as

  • well. Use the table to identify the cost of each topping.

# of toppings 1 2 3 4 5 Cost 15.25 16.50 17.75 19.00 20.25

Answer

Slide 21 / 122

7 Evan is buying pizza from a store that sells each pie for a given price and each topping for set price as

  • well. How much is a pie without any toppings.

# of toppings 1 2 3 4 5 Cost 15.25 16.50 17.75 19.00 20.25

Answer

Slide 22 / 122

8 Evan is buying pizza from a store that sells each pie for a given price and each topping for set price as well. The toppings would be the: A Rate of Change B Initial Value

Slide 23 / 122

9 Evan is buying pizza from a store that sells each pie for a given price and each topping for set price as

  • well. The pizza would be the:

A Rate of Change B Initial Value

Slide 24 / 122

+2 +2 Look at the given graph. What is the slope? What is the y-intercept? Slope is often referred to as . To find the rise count the number up or down to the next point. To find the run count the number left or right to the next point. The rise is +2 and the run is 2. rise run

Slope and Y-Intercept

slide-5
SLIDE 5

Slide 25 / 122

Now let's look at the y-intercept. All you need to do for this is find the point that crosses the y-axis and that is the y-intercept. In this case, the y-intercept is -4. +2 +2

Y-Intercept Slide 26 / 122

10 What is the slope of this graph?

Slide 27 / 122

11 What is the y-intercept of this graph?

Slide 28 / 122

Time in hours

Gallons

3 6 9 12 15 18 21 24 2000 1750 1500 1250 1000 750 500 250

Jorge is emptying his pool. According to this graph, how many gallons were in the pool to start? How quickly is the pool draining?

Find the Answer Slide 29 / 122

Jorge is emptying his pool. According to this graph, how many gallons were in the pool to start? The initial value is where we start at the beginning of the scenario. Notice that when x = 0 there are 2000 gallons in the pool. Therefore Jorge started with 2000 gallons.

Time in hours

Gallons

3 6 9 12 15 18 21 24 2000 1750 1500 1250 1000 750 500 250

Find the Answer Slide 30 / 122

Jorge is emptying his pool. How quickly is the pool draining? To find this we can find the rate

  • f change or the slope.

Find two well plotted points and find the rise over run. This can be interpreted as emptying 1000 gallons every 9 hours or approximately 111 gallons per hour. = -111 approx.

Time in hours

Gallons

3 6 9 12 15 18 21 24 2000 1750 1500 1250 1000 750 500 250

Find the Answer

  • 1000

+ 9

  • 1000

9

slide-6
SLIDE 6

Slide 31 / 122

Notice the slope is negative because the pool is being emptied.

  • 111 approximately

Time in hours

3 6 9 12 15 18 21 24 2000 1750 1500 1250 1000 750 500 250

  • 1000

+ 9 Jorge is emptying his pool. How quickly is the pool draining? To find this we can find the rate of change or the slope. Another way to find this would be to make ordered pairs and use the slope formula. = = =

  • 1000

9 0 - 2000 18-0

  • 2000

18 (0, 2000) (18, 0)

Find the Answer

Gallons

Slide 32 / 122

Number of drinks 1 2 3 4 5 6 Cost 35 30 25 20 15 10 5

12 Sandra is going to a buffet. The meal is a fixed price but she has to pay for each soda she drinks. What is the initial value? Be prepared to explain how it relates to the scenario.

Answer

Slide 33 / 122

13 Sandra is going to a buffet. The meal is a fixed price but she has to pay for each soda she drinks. What is the slope? Use the points (0, 15) and (6, 25). Be prepared to explain how it relates to the scenario.

Number of drinks 1 2 3 4 5 6 Cost 35 30 25 20 15 10 5

Answer

Slide 34 / 122

14 Nora is selling hoodies for a fundraiser at $15 per item. She pays a total of $225 for them. How many does she have to sell to break even?

Hoodies Sold 3 400 Total 350 300 250 200 150 100 50 6 9 12 15 18 21 24

Answer

Slide 35 / 122

15 What does the circled coordinate mean? A This tree grows 4 feet every year. B This tree was planted when it was 4 feet. C There are 4 trees planted. D The tree was planted when it was 4 years old.

Years Since Planting Height

1 2 3 4 5 6 7 8

28 24 20 16 12 8 4 32

Answer

Slide 36 / 122

16 How many feet does the tree grow every year? A 1 foot B 2 feet C 4 feet D 12 feet

Years Since Planting Height

1 2 3 4 5 6 7 8

28 24 20 16 12 8 4 32

Answer

slide-7
SLIDE 7

Slide 37 / 122

Sometimes you will be given a scenario. Turning it into an equation may make it easier to analyze. In a linear equation, we use the slope intercept format of y=mx+b where m is the slope (rate of change) and b is the y-intercept (initial value). In a description, the slope usually pertains to something that will change and is unknown. The y-intercept (initial value) will be a number that stays the same in the scenario, like a flat fee.

Scenarios Slide 38 / 122

y = mx + b Mica is having a pool party. The cost to rent the pool is $325 and $7.00 per person attending the party. Notice that regardless of how many people come, Mica will have to pay $325. This is the initial value, the y-intercept, the "b", also known as the constant. Also notice that it costs $7.00 per person. This amount will change as the number of guests changes. This will be the slope, the rate of change, or the "m". So the equation of this problem becomes: y = 7x + 325

Scenario Slide 39 / 122 Try one!!

Raul is at the gas station. He is filling up his gas tank at $3.45 per gallon and is also buying $12 worth of food from the convenience store. Write an equation to show this scenario.

Slide 40 / 122

17 Sandy charges $45 per necklace that she makes and charges a flat fee of $9 for shipping. Which equation would best fit this scenario? A y = 45x + 9 B y = 9x + 45 C 45 = 9x D 9 = 45x

Slide 41 / 122

18 What does the cost of the necklace represent? A The slope B The y-intercept C The total cost D The initial value Sandy charges $45 per necklace that she makes and charges a flat fee of $9 for shipping.

Slide 42 / 122

19 What does the cost of the shipping represent? A The rate of change B The y-intercept C The slope D The range Sandy charges $45 per necklace that she makes and charges a flat fee of $9 for shipping.

slide-8
SLIDE 8

Slide 43 / 122

20 How much does it cost to buy 5 necklaces? A $9 B $45 C $225 D $234 Sandy charges $45 per necklace that she makes and charges a flat fee of $9 for shipping.

Slide 44 / 122

21 How many necklaces can a person buy with $377? A B C D Sandy charges $45 per necklace that she makes and charges a flat fee of $9 for shipping. 4 6 8 10

Slide 45 / 122

Analyzing a Graph

Return to Table

  • f Contents

Slide 46 / 122

Sometimes you will be given a graph and be asked to describe a situation that would relate to that graph. For example, look at the graph below: Jack is going to school. He walks and takes two buses. Describe his trip to school

Time Distance

Analyzing a Graph Slide 47 / 122

1.Jack walks to the bus stop.

  • 2. He waits for the bus.
  • 3. He takes the first bus.
  • 4. He waits for the second bus.
  • 5. He takes that bus directly to school.

Time Distance 1 2 3 4 5

Analyzing a Graph Slide 48 / 122

Did he have a longer wait for the first bus or the second bus? The first because it is a longer line along the x-axis. Was the first or second bus a longer trip? The first because it went further on the y-axis than the second bus.

click to reveal

Analyzing a Graph

Time Distance 1 2 3 4 5

click to reveal

slide-9
SLIDE 9

Slide 49 / 122

Let's look at another graph. This graph relates to studying for a test and actual test scores. Match the scenario with the point on the graph.

Test score Study Time a b c d e

  • 1. Joanna didn't study but

did fine on her test.

  • 2. William studied a long

time but did poorly on his test.

  • 3. Alfredo studied some and

passed the test.

  • 4. Ingrid studied hard and did

well on the test. Make your own scenario for the fifth point. e a c d b

Studying vs. Test Scores Slide 50 / 122

22 This graph could show a comparison between: A Height and Age B Sugar Used and Amount of Cookies Baked C Daylight and Time of Year D Water Level Before, During, and After a Bath

Slide 51 / 122

23 This graph could show a comparison between: A Height and Age B Sugar Used and Amount of Cookies Baked C Daylight and Time of Year D Water Level Before, During, and After a Bath

Answer

Slide 52 / 122

24 This graph could show a comparison between: A Height and Age B Sugar Used and Amount of Cookies Baked C Daylight and Time of Year D Water Level Before, During, and After a Bath

Answer

Slide 53 / 122

25 This graph could show a comparison between: A Height and Age B Sugar Used and Amount of Cookies Baked C Daylight and Time of Year D Water Level Before, During, and After a Bath

Answer

Slide 54 / 122

26 Which point shows no weight lost over a long time? A B C D Time Weight Lost a b d c

Answer

slide-10
SLIDE 10

Slide 55 / 122

27 Which point shows a lot of weight lost over a long time? A B C D Time Weight Lost a b d c

Answer

Slide 56 / 122

28 Which point shows a lot of weight loss over a short period of time? A B C D Time Weight Lost a b d c

Answer

Slide 57 / 122

Sometimes you will be given a graph and will have to explain the scenario, and other times you will be given a scenario and will have to create the graph. In order to do that you need to decide which variable will go where. There are two types of variables for a graph. Independent Variables go on the x-axis. These are variables which will happen regardless of anything else. Dependent Variables go on the y-axis. These are variables which rely on one or more other variables.

Independent & Dependent Variables Slide 58 / 122

Let's look at the example of Jack going to school. We compared distance and time. The distance that Jack could travel would be based

  • n the amount of time that had elapsed. So it is the dependent
  • variable. Time would
  • ccur regardless of whether Jack traveled to school or not so it is the

independent variable. Dependent Variable = Distance Independent Variable = Time

Independent & Dependent Variables Slide 59 / 122

Dependent Variable = Distance Independent Variable = Time Notice in the graph that Distance is on the y-axis and Time is on the x- axis.

Time Distance

Independent & Dependent Variables Slide 60 / 122

Now you try! With your group figure out the independent and dependent variable. · Cost of a vehicle and time Cost Dependent Time Independent · Distance from a restaurant and time it takes to get there Distance Independent Time Dependent · Amount of sleep and energy the next morning Sleep Independent Energy Dependent

Independent & Dependent Variables

click ______ click ______ click ______ click ______ click ______ click ______

slide-11
SLIDE 11

Slide 61 / 122

29 In the case of the speed of a ball rolling down a hill and the slope of the hill, the speed is independent. False True

Slide 62 / 122

30 In the case of a number of cookies needed and the number of people coming to the party, the number of people is independent. False True

Slide 63 / 122

31 In the case of the speed a ball rolls down a hill and the ball's weight, the speed is independent. False True

Slide 64 / 122

32 In the case of the charge remaining on a phone battery and the amount the phone is used, the phone usage is independent. False True

Slide 65 / 122

So, in order to make a graph, we must first decide on the independent and dependent variable and thus on which axis it will lie. Let's take the example of the distance from a restaurant and the time it takes to get there. We know that the time it takes to get to a restaurant relies (depends) on the distance you are from that restaurant (independent). In this case we would put distance on the x-axis and time on the y-axis.

Independent & Dependent Variables Slide 66 / 122

In this case we would put distance on the x-axis and time on the y-axis.

Time Distance

Independent & Dependent Variables

slide-12
SLIDE 12

Slide 67 / 122

Adapted from Shell Centre for Mathematical Education, University of Nottingham, 1985 http://www.primas-project.eu/artikel/en/1200/The+language+of+functions+and+graphs+/view.do?lang=en

If two species interact as predator and prey there is often an interesting interaction between the two. Sharks are predators and fish are their prey. We can use a graph to show the relationship between these two creatures. On the next slide, make a graph comparing the sharks to the fish using the descriptions given. Keep in mind that sharks rely on the fish to live as you label your graph.

Graph Slide 68 / 122

a

  • a. Due to the absence of sharks,

there is an abundance of fish.

  • b. Since there are so many fish,

sharks come for the food.

  • c. The large quantity of sharks

eat many of the fish.

  • d. There is a very low population
  • f fish because the sharks have

eaten so many of them.

  • e. The sharks leave because

there are too few fish.

  • f. The population of fish increase

because there are so few sharks to eat them.

Adapted from Shell Centre for Mathematical Education, University of Nottingham, 1985 http://www.primas-project.eu/artikel/en/1200/The+language+of+functions+and+graphs+/view.do?lang=en

S h a r k s Fish

Graph Slide 69 / 122

Notice on the last graph there are no numbers. The shark and fish graph is really just a sketch which is an approximation. If we have specific numbers, it is sometimes easier to graph. Example: You are renting a pool for a swim party. The pool rental fee is $125 and you must pay $10 per person. Represent this in graph form.

Graph Slide 70 / 122

You are renting a pool for a swim

  • party. The pool rental fee

is $125 and you must pay $10 per person. Represent this in graph form. First you must decide which is the dependent and independent variable. Independent = People Dependent = Cost

Pool Graph Slide 71 / 122

You are renting a pool for a swim

  • party. The pool rental fee

is $125 and you must pay $10 per person. Represent this in graph form. Next, because there are specific numbers you need to create numbers for your graph. These numbers must be incremental - increasing at a regular rate.

People Cost

Pool Graph Slide 72 / 122

You are renting a pool for a swim

  • party. The pool rental fee

is $125 and you must pay $10 per person. Represent this in graph form. The people can go up by 1s. The cost is a little more tricky. It should go up by 10s but it would be a very long graph if we started at 10 since our first number on the cost side is 125.

People Cost

1 2 3 4 5 6 7 8 9 10

Pool Graph

slide-13
SLIDE 13

Slide 73 / 122

You are renting a pool for a swim

  • party. The pool rental fee

is $125 and you must pay $10 per person. Represent this in graph form. We can start at 125 (because that's

  • ur lowest number) but because we

are not going up by 125s we must put an axis break. This is a symbol to show that there is a in the

  • increment. This can be done by either

a zig-zag line or a space in the y-axis.

People Cost

1 2 3 4 5 6 7 8 9 10

Pool Graph Slide 74 / 122

You are renting a pool for a swim

  • party. The pool rental fee

is $125 and you must pay $10 per person. Represent this in graph form. We can now start at 125 and go up by 10s. Next, we need to plot some points. Remembering back to earlier in this unit, we can make a table.

People Cost

1 2 3 4 5 6 7 8 9 10 215 205 195 185 175 165 155 145 135 125

Pool Graph Slide 75 / 122

You are renting a pool for a swim

  • party. The pool rental fee

is $125 and you must pay $10 per person. Represent this in graph form. If nobody comes we still need to pay $125 so our y-intercept is 125. From there it costs $10 more for each person.

People Cost

1 2 3 4 5 6 7 8 9 10

people

1 2 3 4 5 6

cost

125 135 145 155 165 175 185

215 205 195 185 175 165 155 145 135 125

Pool Graph Slide 76 / 122

You are renting a pool for a swim

  • party. The pool rental fee

is $125 and you must pay $10 per person. Represent this in graph form. We can now plot our points and create a line.

People Cost

1 2 3 4 5 6 7 8 9 10

people

1 2 3 4 5 6

cost

12 5 135 145 155 165 175 185

215 205 195 185 175 165 155 145 135 125

Pool Graph Slide 77 / 122

Now try one! Remember you will not always need an axis break. Chocolate chip cookies call for 3 cups of flour for each 2 dozen

  • cookies. Represent this in a graph.

Cookies Graph Slide 78 / 122

Tom and Mara are going for a drive. Their car gets 32 miles to the gallon which means they use one gallon of gas every 32 miles. Represent this situation with a graph.

Gas Graph

slide-14
SLIDE 14

Slide 79 / 122

The average infant weighs 7 lbs at birth and then gains approximately 1 lb every 3 weeks until 4 months old. Represent this in a graph.

Infant Graph Slide 80 / 122 Slide 81 / 122 Slide 82 / 122

35 Ellen is selling lemonade. She is charging $1 per cup and spends $10 in supplies. She wants to graph her

  • earnings. Did she do it right?

Yes No

Slide 83 / 122 Slide 84 / 122

37 The recycling club has gained 3 members every two

  • weeks. Which of the graphs represents this scenario?

A B C D

slide-15
SLIDE 15

Slide 85 / 122

One way to analyze a function is to assess if the rate of change (slope) is positive or negative. A positive rate of change will show a ratio that continues upward so both the x and y will be progressing in a positive manner or both will progress in a negative manner. (Remember, a negative divided by a negative is a positive.) With a negative rate of change, there will be a ratio that continues downward so either the x or the y will be progressing in a negative manner.

Rate of Change Slide 86 / 122

It is quite simple to identify a positive or negative rate of change, but is different with each kind of representation of a function.

Rate of Change Slide 87 / 122

With an equation, we look at the slope. If the slope is positive number, the function has a positive rate of change. If the slope is a negative number, the function has a negative rate of change. Example: y = 3x + 4 y = -2x + 6 Because the 3 is the slope Because -2 is the slope and 3 is positive, the rate and -2 is negative, the

  • f change is positive.

rate of change is negative.

Rate of Change Slide 88 / 122

38 Which functions have a positive rate of change? A y = 2x + 5 B y = -2x + 5 C y = 2x - 5 D y = -2x - 5 E y = 7x + 4 F y = 7x - 4

Slide 89 / 122

39 Which functions have a negative rate of change? A y = -4x + 3 B y = -4x - 3 C y = 4x + 3 D y = 4x - 3 E y = -6x + 3 F y = -6x - 3

Slide 90 / 122

40 When looking for a positive rate of change: A Look for a slope with one negative and one positive B Look for a positive constant C Look for a positive coefficient D Look for a slope with two positives E Look for a slope with two negatives F A, B, and C G B, C, and D H C, D, and E

slide-16
SLIDE 16

Slide 91 / 122

41 When looking for a negative slope: A Look for a negative coefficient B Look for a negative constant C Look for a slope with two negatives D Look for a slope with one negative and one positive E A and B F B and C G C and D H A and D

Slide 92 / 122

With ordered pairs or a table, we can either use the slope formula to find the slope and then identify it as either positive or negative like an equation, or we can simply identify how the x- coordinate and y-coordinate are moving. Remember, two positives or two negatives make a positive rate of change, and one positive and one negative make a negative rate of change.

Rate of Change Slide 93 / 122

+1 +1 +1 +1 +1 +1 +3 +3 +3 +3 +3 +3

x 1 2 3 4 5 6 7 y 3 6 9 12 15 18 21

In the above case, both the x and y coordinates are moving in a positive direction so it is a positive rate of change.

Rate of Change Slide 94 / 122

  • 1
  • 1
  • 1
  • 1
  • 1
  • 1
  • 3
  • 3
  • 3
  • 3
  • 3
  • 3

x 5 4 3 2 1

  • 1

y 10 7 4 1

  • 2
  • 5
  • 8

In this case both the x and y coordinates are moving in a negative direction so it is also a positive rate of change.

Rate of Change Slide 95 / 122

x 1 2 3 4 5 6 7 y 3 6 9 12 15 18 21 x 5 4 3 2 1

  • 1

y 10 7 4 1

  • 2
  • 5
  • 8

Also note that if we use the slope formula the slope (rate of change) is positive in either case. In this case both the x and y coordinates are moving in a negative direction so it is also a positive rate of change. 6 - 3 3 2 - 1 1 = = 3 7 - 10 -3 4 - 5 -1 = = 3

Rate of Change Slide 96 / 122

Example: Look at the following ordered pairs. {(1,4), (2, 2), (3, 0), (4, -2), (5, -4)} Notice that while the x value goes up, the y value goes down. This is an indication that there is a negative rate of change because one value is going up while the other is going down. We can also use the slope formula to figure out if it is a negative rate

  • f change.

2 - 4 -2 2 - 1 1 = = -2

Rate of Change

slide-17
SLIDE 17

Slide 97 / 122

42 The following ordered pairs have a positive rate of change. {(4, 8), (5, 10), (6, 12), (7, 14), (8, 16)} True False

Slide 98 / 122

43 The following table has a positive rate of change. x 14 15 16 17 18 19 20 y 8 6 4 2

  • 2
  • 4

True False

Answer

Slide 99 / 122

44 Which one of the following sets of ordered pairs has a negative rate of change? A {(-2, 5), (-1, 7), (0, 9), (1, 11)} B {(3, 1), (6, 3), (9, 5), (12, 7)} C {(-20, -5), (-15, -4), (-10, -3), (-5, -2)} D {(1, -1), (2, -2), (3, -3), (4, -4)}

Slide 100 / 122

45 Which one of the following set of ordered pairs has a positive rate of change? A {(3, -7), (4, -9), (5, -11), (6, -13)} B {(-6, -2), (-3, -1), (3, 1), (6, 2)} C {(12, 5), (14, 4), (16, 3), (18, 2)} D {(-5, 1), (-6, 2), (-7, 3), (-8, 4)}

Slide 101 / 122

Comparing Different Representations

  • f a Function

Return to Table

  • f Contents

Slide 102 / 122

We have learned how to represent a function several ways: Table/Ordered Pairs Graph Equation Verbal Description (Scenario) Next we will compare two different models to each other. We will look at the relationship between the two models in terms of the rate of change.

Comparing Representations

slide-18
SLIDE 18

Slide 103 / 122

In order to compare the rate of change of two different types of representations of functions we simply find the rate of change of each and compare them. The higher the absolute value of the rate of change, the bigger it is. For example, if a graph has a slope of -4 and an equation has a slope

  • f 3, the slope of the graph is steeper because the absolute value of -4

= 4 and the absolute value of 3 = 3. 4 > 3 so The graph has a bigger slope, or rate of change.

Comparing Representations Slide 104 / 122

Let's try one!

(1, 1) (2, 3) (3, 5)

y = -5x +6 Slope = -5 Slope = 3-1 2 2-1 1 = = 2 absolute value of -5 = 5 and absolute value of 2 = 2 5>2 so A has a greater rate of change than B. A B Which has a greater rate of change? 1 2 3

Comparing Representations Slide 105 / 122

Let's try to compare a table and a verbal model. Chris and Shari are going to have a bowling party. It costs $10 to rent a lane and $2 per pair of shoes. A B x 2 4 6 8 10 12 14 y 7 13 19 25 31 37 41 Which has the greater rate of change? (continued...)

Comparing Representations Slide 106 / 122

Chris and Shari are going to have a bowling party. It costs $10 to rent a lane and $2 per pair of shoes. A We can turn this into an equation. 10 is a constant fee. 2 changes depending on the amount of people at the

  • party. So the equation is y = 2x + 10.

The rate of change = 2

Comparing Representations Slide 107 / 122

B x 2 4 6 8 10 12 14 y 7 13 19 25 31 37 41 Which has the greater rate of change? To find the rate of change we can use the slope formula. 13 - 7 6 4 - 2 2 = = 3 The rate of change is 3.

click to reveal

Answer

Slide 108 / 122

46 Which has the greater rate of change? A {(1, 4), (2, 6), (3, 8), (4, 10), (5, 12)} B

Answer

slide-19
SLIDE 19

Slide 109 / 122

47 Which has the greater rate of change? A y = 1/3x + 5 B Victoria and Sandy were selling cookies. They charged $1 for 2 cookies.

Slide 110 / 122

48 Which has the greater rate of change? A Schuyler and Craig were doing dishes at a rate of 3 dishes per minute. B

Answer

Slide 111 / 122

49 Which has the greater rate of change? A y = x - 4 B x

  • 9
  • 6
  • 3

3 6 9 y

  • 4
  • 3
  • 2
  • 1

1 2

Answer

Slide 112 / 122

50 Which has the greatest rate of change? A {(1, 3), (2, 4), (3, 5), (4, 6), (5, 7)} B Ryan and Andrew jump down the stairs 3 steps at a time. C y = 1/8x - 2 D

Answer

Slide 113 / 122

51 Which has the greatest rate of change? A Emily and Gavin are making banana pancakes. They slice up 2 bananas for every dozen pancakes. B y = 5x + 6 C {(9, 3), (6, 2), (3, 1), (0, 0), (-3, -1)} D

Answer

Slide 114 / 122

52 Functions W and Z are both linear functions of x.

A The slope of Function W is less than the slope of Function Z. B The slopes of Function W is greater than the slopes of Function Z. C The y-intercept of Function W is equal to the y-intercept of Function Z. D The y-intercept of Function W is less than the y-intercept of Function Z. E The y value when x = -4 for Function W is greater than the value of x = -4 for Function Z. F The y value when x = -4 for Function W is equal to the y value when x = -4 for Function Z. Which statement(s) comparing the functions is(are) true?

From PARCC EOY sample test calculator #5

slide-20
SLIDE 20

Slide 115 / 122

53 Functions A, B and C are linear functions. Some values of Function A are shown in the table. The graph of Function B has a y-intercept of (0,3) and an x-intercept of (-5,0). Function C is defined by the equation y = (3x +1). Order the linear functions based on rate of change, from least to greatest.

From PARCC EOY sample test calculator #10

Slide 116 / 122

Glossary

Return to Table

  • f Contents

Slide 117 / 122

Back to Instruction

Axis Break

A jump in either the x-axis or y-axis that skips over a wide range of values.

Break goes from 0 to 125!

Slide 118 / 122

Back to Instruction

Dependent Variable

Something that depends on other factors.

  • n the y-axis

Ashley was walking in the park. She started from her home and then took a nature walk. She then examined the distance she walked and the amount of time it took.

Dependent Variable Distance

**The distance walked is based on the time that passes!**

Slide 119 / 122

Function

A relation where every input (x) has exactly one output (y).

Back to Instruction

Slide 120 / 122

Back to Instruction

Independent Variable

A variable that stands alone and isn't changed by the other variables you are trying to measure.

  • n the x-axis

Ashley was walking in the park. She started from her home and then took a nature walk. She then examined the distance she walked and the amount of time it took.

Independent Variable Time **Time occurs no matter what happens!**

slide-21
SLIDE 21

Slide 121 / 122

Back to Instruction

Negative Rate of Change

A ratio that continues downward so either the x or the y will be progressing in a negative manner.

rate of change slope (m) m = rise run change in y change in x = rate of change negative slope (m) negative

  • m = - rise

+ run = + rise

  • run

y = -5x + 2

  • m =
  • 5

+ 1

  • 5 =

Slide 122 / 122

Back to Instruction

Positive Rate of Change

A ratio that continues upward so both the x and y will be progressing in a positive manner or both will progress in a negative manner.

rate of change slope (m) m = rise run change in y change in x = rate of change positive slope (m) positive +m = + rise + run = - rise

  • run

y = 5x + 2

+m = + 5 + 1 +5 =