
SLIDE 1
Internationalisation of services Changes in industrial organisation - - PowerPoint PPT Presentation
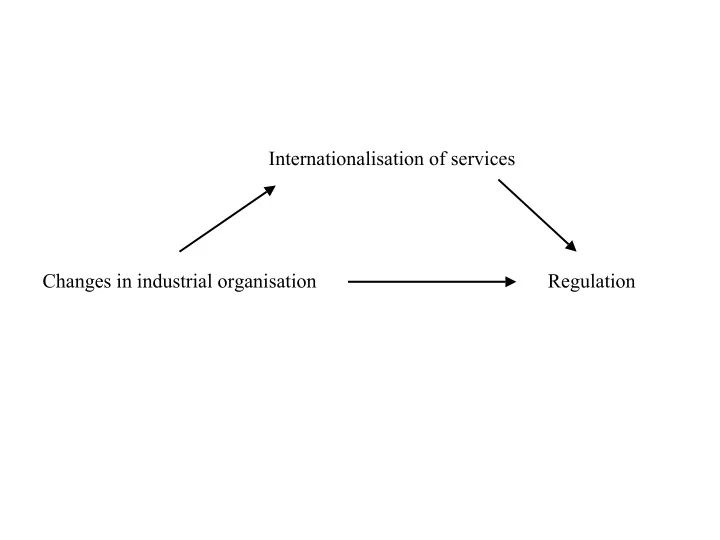
Internationalisation of services Changes in industrial organisation Regulation Which Regulation? GATS TRIPS TRIMs Technical Barriers to Trade Information Technology Agreement Basic Telecommunications Agreement
5,000 10,000 15,000 20,000 25,000 30,000 35,000 1 9 7 1 1 9 7 3 1 9 7 5 1 9 7 7 1 9 7 9 1 9 8 1 1 9 8 3 1 9 8 5 1 9 8 7 1 9 8 9 1 9 9 1 1 9 9 3 1 9 9 5 1 9 9 7 1 9 9 9 US$ billions Agriculture Industry Services, etc. 0% 10% 20% 30% 40% 50% 60% 70% 80% 90% 100% 1 9 7 1 1 9 7 3 1 9 7 5 1 9 7 7 1 9 7 9 1 9 8 1 1 9 8 3 1 9 8 5 1 9 8 7 1 9 8 9 1 9 9 1 1 9 9 3 1 9 9 5 1 9 9 7 1 9 9 9 Agriculture Industry Services, etc.
10 20 30 40 50 60 70 80 90 100 2 2.5 3 3.5 4 4.5 5 GDP per capita (log PPP current international dollar) Services value added (% of GDP)
Agriculture Industry Services Total Gross value added Total industry Of which manufacturing US$ billion World* 4.0 30.0 20.1 66.1 100.0 29,272 OECD* 1.9 28.4 19.6 69.7 100.0 22,868 European Monetary Union 2.5 29.0 21.0 68.5 100.0 5,438 Low & middle income 12.6 36.7 22.8 50.7 100.0 5,566 East Asia & Pacific 15.1 48.1 32.6 36.7 100.0 1,530 Europe & Central Asia 8.8 34.7 .. 56.5 100.0 876 Latin America & Caribbean 7.1 30.6 18.5 62.3 100.0 1,748 Middle East & North Africa .. .. .. .. .. South Asia 24.9 25.6 15.2 49.6 100.0 567 Sub-Saharan Africa 20.8 29.7 12.1 49.6 100.0 289 LDCs 32.1 25.4 10.6 42.5 100.0 187 United States* 1.6 24.9 17.2 73.5 100.0 9,119 United Kingdom 1.0 27.4 .. 71.6 100.0 1,260 Japan* 1.4 31.8 21.6 66.8 100.0 2,008 China 15.2 51.1 35.4 33.6 100.0 1,044 Hong Kong 0.1 13.4 5.2 86.5 100.0 156 Indonesia 17.0 45.6 25.0 37.5 100.0 138 Denmark 2.8 26.2 17.0 71.0 100.0 139
1985 1990 1995 1999 2000 2001 2002 World 100.0 114.0 121.1 125.8 125.6 .. .. OECD 100.0 102.8 107.5 111.5 111.7 .. .. European Monetary Union 100.0 103.9 110.2 113.6 113.6 114.0 .. Low & middle income 100.0 104.8 116.9 122.7 121.2 120.5 .. East Asia & Pacific 100.0 109.2 108.7 107.0 106.5 107.3 108.7 Europe & Central Asia .. .. .. .. .. .. .. Latin America & Caribbean 100.0 116.3 126.9 139.0 137.3 134.8 .. Middle East & North Africa .. .. .. .. .. .. .. South Asia 100.0 102.7 108.9 116.3 117.7 119.7 123.8 Sub-Saharan Africa 100.0 106.7 115.0 116.6 114.1 113.4 111.3 LDCs* .. 100.0 100.0 97.1 96.3 98.0 .. United States 100.0 104.9 108.0 110.1 110.1 .. .. United Kingdom 100.0 107.7 113.2 120.2 120.2 122.6 .. Japan 100.0 101.5 111.2 115.5 116.2 .. .. China 100.0 109.9 107.6 115.5 116.6 117.9 119.2 Hong Kong 100.0 107.0 120.5 122.7 123.3 124.5 .. Indonesia 100.0 101.3 100.3 90.4 89.5 91.5 93.0 Denmark 100.0 103.3 105.6 107.0 105.0 106.4 ..
1985 1990 1995 1999 2000 2001 % of GDP % of FDI
% of GDP % of FDI
% of GDP % of FDI
% of GDP % of FDI
% of GDP % of FDI
% of GDP % of FDI
Primary sector 0.05% 9.1% 0.07% 5.8% 0.04% 3.0% 0.10% 2.1% 0.24% 4.1% 0.20% 9.5% Industry 0.19% 34.6% 0.48% 39.7% 0.55% 41.4% 1.75% 37.2% 0.91% 15.6% 0.43% 20.4% Services 0.31% 56.4% 0.66% 54.6% 0.74% 55.6% 2.85% 60.6% 4.70% 80.3% 1.48% 70.1% Total 0.55% 100.0% 1.21% 100.0% 1.33% 100.0% 4.70% 100.0% 5.85% 100.0% 2.11% 100.00%
1985-89 1990-94 1995-99 2000 2001 Canada Industry 0.09% 0.12% 0.20% .. .. Services 0.51% 0.31% 2.13% 4.34% 3.21% Denmark Industry 0.23% 0.57% 0.74% 0.68% 0.93% Services 0.59% 0.89% 2.09% 14.27% 4.42% France Industry 0.43% 0.51% 0.64% 1.37% 0.86% Services 0.47% 0.64% 2.51% 11.67% 5.03% Germany Industry 0.37% 0.42% 1.28% 0.98%
Services 0.27% 0.49% 1.48% 1.52% 2.28% Italy Industry 0.06% 0.13% 0.04% 0.32% 0.43% Services 0.31% 0.41% 0.45% 0.60% 0.68% Japan Industry 0.34% 0.33% 0.50% 0.25% 0.35% Services 1.04% 0.75% 0.61% 0.77% 0.42% Korea Industry 0.08% 0.23% 0.37% 0.21% 0.32% Services 0.03% 0.14% 0.29% 0.53% 0.10% Netherlands Industry 1.48% 1.87% 3.10% 6.12% 1.71% Services 1.15% 2.12% 4.82% 12.67% 8.18% Norway Industry .. .. 0.59% ..
Services .. .. 1.26% .. 2.05% Spain Industry 0.06% 0.08% 0.91% 0.74% 0.99% Services 0.25% 0.50% 1.83% 8.91% 3.44% Sweden Industry .. 0.93% 2.02% 3.72% .. Services .. 1.12% 1.45% 9.58% .. United Kingdom Industry 1.81% 0.99% 2.19% 1.59% 0.90% Services 1.36% 0.88% 3.39% 14.65% 0.92% United States Industry 0.20% 0.28% 0.38% .. 0.36% Services 0.30% 0.46% 0.78% .. 0.99%
Note: Period averages are calculated as the simple average of the individual years. Note: If more than two years are missing in a five-year period, ‘not available’ is reported in the table, otherwise the average of the remaining years is used. Source: Calculations based on data from World Development Indicators (GDP) and SourceOECD (FDI in local currency, exchange rates).