
SLIDE 1
1
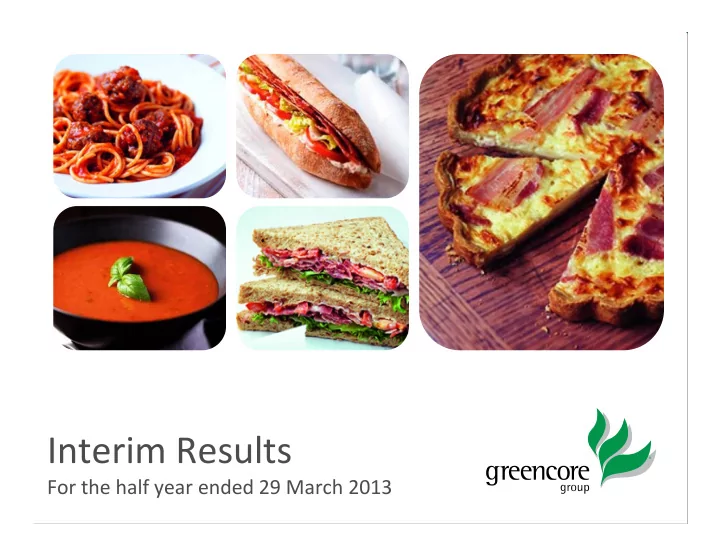
Interim Results
For the half year ended 29 March 2013
Interim Results For the half year ended 29 March 2013 1 AGENDA - - PowerPoint PPT Presentation
Interim Results For the half year ended 29 March 2013 1 AGENDA Highlights Patrick Coveney, CEO Financial Review Alan Williams, CFO Operating & Strategic Review Patrick Coveney, CEO Outlook Patrick Coveney, CEO Q&A Open to the
1
For the half year ended 29 March 2013
2
AGENDA
Open to the Floor Q&A Patrick Coveney, CEO Outlook Patrick Coveney, CEO Operating & Strategic Review Alan Williams, CFO Financial Review Patrick Coveney, CEO Highlights
3
HIGHLIGHTS
growth despite volume headwinds
Alan Williams Chief Financial Officer
5
FINANCIAL SUMMARY
£572.9m £572.9m
Revenue Revenue
+0.9% +0.9% 6.1p 6.1p
Adjusted earnings per share2 Adjusted earnings per share2
+10.9% +10.9%
H1 13 Versus H1 12
£33.7m £33.7m
Operating profit1 Operating profit1
+6.3% +6.3% 5.9% 5.9%
Operating margin1 Operating margin1
+30 bps +30 bps
1.
Operating profit and margin are stated before exceptional items and acquisition related amortisation
2.
Adjusted profit before tax and adjusted earnings measures are stated before exceptional items, pension finance items, acquisition related amortisation, FX on inter-company and certain external balances and the movement in the fair value of all derivative financial instruments and related debt adjustments
£26.5m £26.5m
Adjusted PBT2 Adjusted PBT2
+9.9% +9.9%
6
CONVENIENCE FOODS
by changes in the portfolio during the period
mainly due to impact of horsemeat scandal and lower market growth rates
net impact of MarketFare and Schau acquisitions and portfolio rationalisation in the ‘legacy’ business
challenging conditions due to strong
+4.7% 30.7 32.1 Operating profit1 +10 bps 5.8% 5.9% Operating margin1 +1.8% 532.6 542.1 Revenue % change H1 12 £m H1 13 £m
* Like for Like revenue excludes both the International Cuisine acquisition and the Uniq desserts activities which were exited or sold
7
INGREDIENTS & PROPERTY
edible oils trading activity while the molasses feed business benefitted from poor weather in the period
better mix in oils and growth in molasses revenues
site is now definitive and marketing will commence over next few months as planned
legacy Irish property portfolio +53.4%
% change
+57.8%
% change constant currency
1.0 1.6
Operating profit1
35.1 30.8
Revenue H1 12 £m H1 13 £m
Division represents c. 5% of Group activity Division represents c. 5% of Group activity
8
FINANCING AND TAX
Financing
effective interest rate on primary bank facilities
£7.7m (H1 12: £7.9m) Tax
4%) benefitting from historic tax losses
and the net movement in current and deferred tax provisions
*Pension financing charge, fair value of derivatives and related debt adjustments and charge related to present value of assets and liabilities.
9
EXCEPTIONAL ITEMS
(9.2)
Property related charges
0.4
Net exceptional credit
8.6
Tax relief on exceptional items and resolution of tax positions
(8.1)
Pre tax impact
4.4
Pension curtailment gain
(1.1)
Integration costs of US acquisitions
(2.2)
Integration costs of UK acquisitions Income Statement £m
H1 13 Exceptional Items
10
EPS AND DIVIDEND
1.75p 1.90p Interim dividend per share 5.5p 6.1p Adjusted earnings per share2 382.3m 391.5m Denominator for earnings per share £21.1m £23.8m Adjusted earnings2
H1 12 H1 13 EPS & Dividend EPS
Dividend
dividend distribution in line with adjusted earnings per share growth in the financial year
11
(122.4) (113.1) (9.3) 2.2 (4.3) (10.1) (7.0) 9.9 (7.2) (14.1) (12.2) 43.4 H1 12 (10.6) Exceptionals 2.6 Operating cashflow (6.3) Pension financing (7.6) Interest & tax (5.0) Dividends paid (14.6) Increase in net debt from year end 8.4 Acquisitions/disposals (23.0) Cash outflow before M&A activity (3.7) Other including FX (18.4) Net capex (17.3) Working capital movement 45.9 EBITDA H1 13 £m
CASHFLOW
Lower operating cash inflow driven by seasonal working capital outflow (H1 12 benefitted from reductions in working capital in former Uniq businesses) and phasing of capital expenditure Lower operating cash inflow driven by seasonal working capital outflow (H1 12 benefitted from reductions in working capital in former Uniq businesses) and phasing of capital expenditure
12
NET DEBT AND LEVERAGE
leverage for bank covenant purposes
working capital outflow, capital expenditure and adverse FX movement of £5.0m on translation of USD denominated debt
£438m and a weighted average maturity of 2.8 years at 29 March 2013
area for the Group
13
PENSIONS
accrual with effect from 2010
related deferred tax asset, an increase of £10.1m from September 2012
key driver is a material increase in UK inflation expectations despite a further fall in discount rates
place to address £40m of the actuarial deficit in the primary UK scheme
14
SUMMARY - BUSINESS PERFORMANCE GOALS
ahead of overall UK Food
Channel fresh food offer
cost inflation through efficiencies
*Operating Profit before exceptional items and acquisition related amortisation
Return on Capital
Revenue
Operating profit*
Interest & Tax
PATRICK COVENEY CHIEF EXECUTIVE OFFICER
16
STRATEGIC PROGRESS IN FY13 Complete Uniq Integration Complete Uniq Integration Absorb International Cuisine Absorb International Cuisine Scale-up US Business Scale-up US Business
transfer of premium products from Minsterley
track
and Chicago facilities
1 1
17
UK MARKET CONTEXT 2 2
* Source, Nelsen, pre-defined chilled convenience foods categories
Chilled Convenience* Household budgets still under significant pressure Household budgets still under significant pressure Retailers facing challenging volume environment Retailers facing challenging volume environment Weather – the coldest March in the UK since 1962 Weather – the coldest March in the UK since 1962 Impact of horsemeat scandal on consumer confidence Impact of horsemeat scandal on consumer confidence
52 w/e October 2012 26 w/e March 2013
18
UK CONVENIENCE PERFORMANCE
3 3
Delivering margin enhancement in low volume growth environment
reduction across portfolio
reduction across portfolio
Challenge
Seeding future growth in uncertain and challenging environment
channels
set – while organising to help every customer ‘win’!
excite consumers, deliver ‘provenance’, drive health and build value for us and our customers
channels
set – while organising to help every customer ‘win’!
excite consumers, deliver ‘provenance’, drive health and build value for us and our customers
Greencore actions in H1 Greencore actions in H1
19
Market share Pre-packed sandwiches
Market share Pre-packed sandwiches
* Estimated Nielsen 52 w/e 30 March 2013 and Greencore retail sales figures ** Estimated Nielsen 26 w/e 30 March 2013 and Greencore retail sales figures, weighted average total food to go
UK CONVENIENCE PERFORMANCE
3 3
revenue
revenue
product mix provides resilient performance in uncertain and challenging market
comparators slowed market growth substantially in H1**
0.1%
and range enhancement with core customers (rather than new customer wins) with focus on health, provenance, sustainability and consumer excitement
20
Prepared Meals
for like performance 5.9% lower*
quiche, soup and chilled sauces
Italian, impacted by horsemeat scandal
3.1%
UK CONVENIENCE PERFORMANCE
* Excludes the impact of the International Cuisine acquisition ** Nielsen 26 w/e 30 March 2013
3 3
Supply chain
simplification – exit of number of suppliers
positive release
all beef related products
Supply chain
simplification – exit of number of suppliers
positive release
all beef related products
Consumers
sourced product ranges
consumer confidence with customers through labelling, PR and promotional initiatives
Consumers
sourced product ranges
consumer confidence with customers through labelling, PR and promotional initiatives
Sites
enhanced speciation controls
resource to drive best practice
Sites
enhanced speciation controls
resource to drive best practice
Customers
chain best practice with customers
development of industry code of practice for speciation controls
Customers
chain best practice with customers
development of industry code of practice for speciation controls
Horsemeat scandal
Horsemeat scandal
21
table sauces and pickles; Frozen Foods comprised of Yorkshire puddings and toad-in- the-hole
flat cooking sauce market**
economic model and new channel growth
will also assume management of our retail cakes business in Hull
Market share O/L cooking sauces
Market share O/L cooking sauces
UK CONVENIENCE PERFORMANCE
* Nielsen 52 w/e 30 March 2013 ** Nielsen 26 w/e 30 March 2013
3 3
22
acquisition and successful integration of MarketFare and Schau
area in January out of Newburyport and subsequently launched in Chicago, Fredericksburg and Jacksonville in April
sites delivering a tighter product portfolio focused on food to go and salads
GREENCORE USA
4 4
23
GREENCORE USA
4 4
Newburyport, MA
233 stores
Salt Lake City, UT 124 stores, (sauces distributed nationally)
Stores served by Greencore today
1,363 1,985
Chicago, IL
406 stores 484 stores
Fredericksburg, VA
1,187 stores 380 stores
Brockton, MA
268 stores
Jacksonville, FL
266 stores
12% 20%
% of total US stores served
24
A FOCUSED GROWING FOOD TO GO LEADER
reshaping the Group’s strategy and prospects
UK Food to Go UK Food to Go UK Prepared Meals UK Prepared Meals UK Grocery & Frozen Foods UK Grocery & Frozen Foods UK Cakes & Desserts UK Cakes & Desserts US Food to Go US Food to Go Ingredients & Property Ingredients & Property
rate revenue
40 20 10 10 15 5
Revenue
£1.2bn
Revenue
£1.2bn
5 5
25
OUTLOOK
remain challenging in the UK
fully from horsemeat scandal
pressure
ability to deliver adjusted EPS growth in FY13 in line with expectations
6 6