
Financial results for the year ended March 31, 2019 Appendix
INPEX CORPORATION May 14, 2019
1
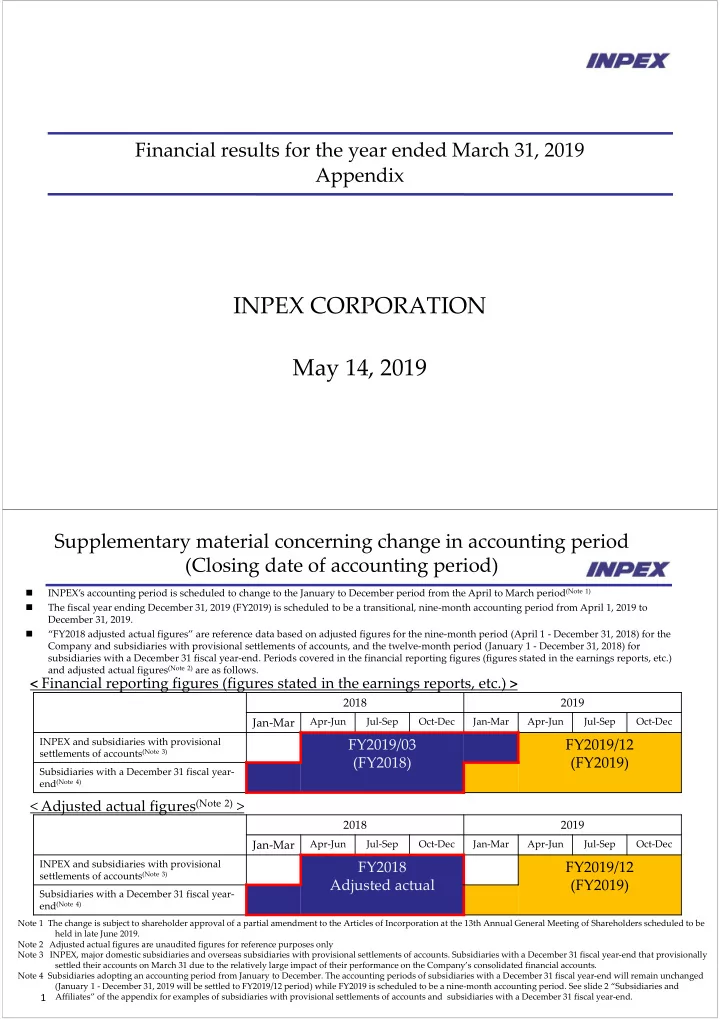
Supplementary material concerning change in accounting period (Closing date of accounting period)
INPEX’s accounting period is scheduled to change to the January to December period from the April to March period(Note 1) The fiscal year ending December 31, 2019 (FY2019) is scheduled to be a transitional, nine‐month accounting period from April 1, 2019 to December 31, 2019. “FY2018 adjusted actual figures” are reference data based on adjusted figures for the nine‐month period (April 1 ‐ December 31, 2018) for the Company and subsidiaries with provisional settlements of accounts, and the twelve‐month period (January 1 ‐ December 31, 2018) for subsidiaries with a December 31 fiscal year‐end. Periods covered in the financial reporting figures (figures stated in the earnings reports, etc.) and adjusted actual figures(Note 2) are as follows.
Note 1 The change is subject to shareholder approval of a partial amendment to the Articles of Incorporation at the 13th Annual General Meeting of Shareholders scheduled to be held in late June 2019. Note 2 Adjusted actual figures are unaudited figures for reference purposes only Note 3 INPEX, major domestic subsidiaries and overseas subsidiaries with provisional settlements of accounts. Subsidiaries with a December 31 fiscal year‐end that provisionally settled their accounts on March 31 due to the relatively large impact of their performance on the Company’s consolidated financial accounts. Note 4 Subsidiaries adopting an accounting period from January to December. The accounting periods of subsidiaries with a December 31 fiscal year‐end will remain unchanged (January 1 ‐ December 31, 2019 will be settled to FY2019/12 period) while FY2019 is scheduled to be a nine‐month accounting period. See slide 2 “Subsidiaries and Affiliates” of the appendix for examples of subsidiaries with provisional settlements of accounts and subsidiaries with a December 31 fiscal year‐end.
2018 2019 Jan‐Mar
Apr‐Jun Jul‐Sep Oct‐Dec Jan‐Mar Apr‐Jun Jul‐Sep Oct‐Dec INPEX and subsidiaries with provisional settlements of accounts(Note 3)
FY2019/03 (FY2018) FY2019/12 (FY2019)
Subsidiaries with a December 31 fiscal year‐ end(Note 4)
< Financial reporting figures (figures stated in the earnings reports, etc.) >
2018 2019 Jan‐Mar
Apr‐Jun Jul‐Sep Oct‐Dec Jan‐Mar Apr‐Jun Jul‐Sep Oct‐Dec INPEX and subsidiaries with provisional settlements of accounts(Note 3)
FY2018 Adjusted actual FY2019/12 (FY2019)
Subsidiaries with a December 31 fiscal year‐ end(Note 4)