
SLIDE 1
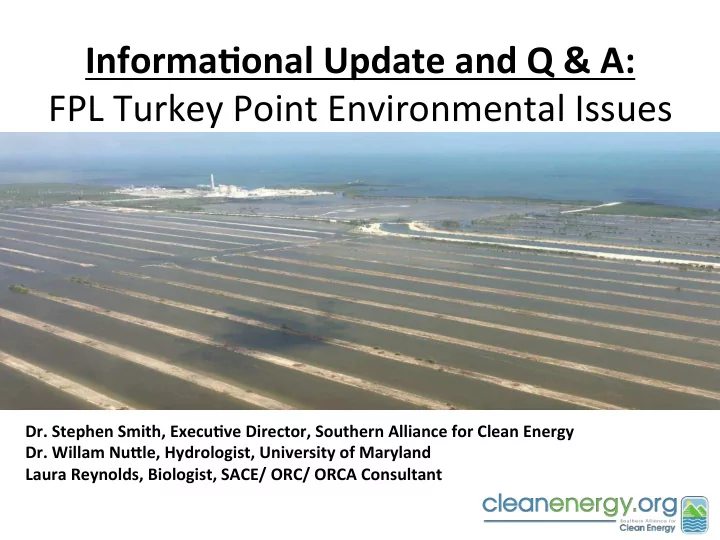
Informa(onal Update and Q & A: FPL Turkey Point Environmental Issues
- Dr. Stephen Smith, Execu(ve Director, Southern Alliance for Clean Energy
- Dr. Willam NuDle, Hydrologist, University of Maryland
Laura Reynolds, Biologist, SACE/ ORC/ ORCA Consultant