Index of Aggregate Work Hours per Person Index, 2007=100 Monthly - - PowerPoint PPT Presentation

index of aggregate work hours per person
SMART_READER_LITE
LIVE PREVIEW

Index of Aggregate Work Hours per Person Index, 2007=100 Monthly - - PowerPoint PPT Presentation

Index of Aggregate Work Hours per Person Index, 2007=100 Monthly data available as of Feb-2016 Apr 2017 Large-employer determination fully enforced Stimulus finally ends Source: blogsupplyanddemand.com The Employer Mandate


slide-1
SLIDE 1

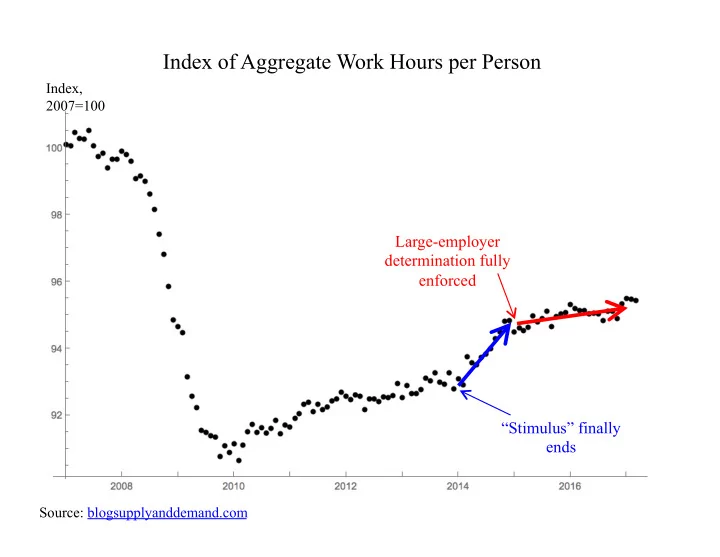
“Stimulus” finally ends Large-employer determination fully enforced

Index, 2007=100

Index of Aggregate Work Hours per Person

Monthly data available as of Feb-2016 Apr 2017 Source: blogsupplyanddemand.com

slide-2
SLIDE 2

The Employer Mandate

  • Beginning in 2015, employers are designated as small
  • r large based on 50 full-time-equivalent (FTE)

employees

– Each part-time worker is a partial FTE in proportion to his monthly hours worked – Large designation creates a mandate for the subsequent year

  • Offer compliant and “affordable” coverage or pay a

monetary penalty

  • Penalty applies only to full-time employees, only

during the months that they are on the payroll

  • Indexed to health insurance costs
  • Unlike salaries, penalties are not deductible from

business taxes. Salary equivalent of $2k penalty is about $3k.

slide-3
SLIDE 3

Source Side Effects: The Economic Consequences of the Health Reform. acasideeffects.com

Expense items Salary raised 2017 ACA penalty 2,265 Salaries 3,449 Payroll tax 264 7.65% rate Business income taxes

  • 1,448

39% rate Net result for employer expenses including taxes: $2,265 $2,265

Table 1. The salary equivalent of the 2017 employer penalty

Scenario: Penalty imposed

At the threshold, one more hire costs 20 penalties: $68,980 annually, plus salary and benefits.

slide-4
SLIDE 4

.1 .2 .3 Density 2 4 6 8 10 Hours per week

Figure 1. The employer penalty's hour-equivalent distribution

minimum wage workers average

slide-5
SLIDE 5
  • Evaders do not want to be measured

– Confidential sample of people at corps, rather than corps.

  • How to know when a regulation is binding?

– Literature solution: look at France! Or tax payments. Or both. – Measure size and compliance together

  • The enforcement probability function is often unpublished
  • Even bright-line thresholds apply to size measures that are

not readily available

– Get good (enough) measures of size; a bit of econometrics.

Measurement challenges

slide-6
SLIDE 6

Source: French data via Garicano et al.

slide-7
SLIDE 7

Source: Garicano et al. Year is 2003.

slide-8
SLIDE 8

0.47 0.48 0.49 0.50 0.51 2008 2009 2010 2011 2012 2013 2014 2015 2016

Figure 1. Share of private-sector MEPSnetIC firms sized 25-99 with fewer than 50 employees

(FT and PT counted equally)

First year of large-employer determination without transition relief applicable in the subsequent (i.e., coverage) year

In theory, this masks a number of small employers (< 50 FTEs) with more than 50 employees

slide-9
SLIDE 9

MEPS suggests that most 49ers have less than 49 FTEs

slide-10
SLIDE 10

Hanover survey subscription

  • One year of unlimited surveys = $45k

– Only one survey at a time

  • Variable cost per respondent

– Related to the respondent value of time – E.g., business managers cost more than generic household – Mercatus paid $19k for 745 respondents

  • i.e., our respondents got about $100 per hour

– Survey took 10-15 minutes – Reward system (e.g., sporting tickets, hotel, airline tickets)

  • Other purchase plans would also be about $40k
slide-11
SLIDE 11

March 2017 national sample of 745 employers with 2-199 FT employees

Non-ESI firms stay below 50 ESI firms do not

About 38,000 Non-ESI firms “move”

slide-12
SLIDE 12

Non-ESI firms stay below 50 ESI firms do not

20 12 49

  • Num. obs. in green
  • Avg. of the 81
slide-13
SLIDE 13

0% 1% 2% 3% 4% 5% 6%

Less than 10 employees 10-24 employees 25-49 employees 50-99 employees 100-999 employees 1000 or more employees

Growth in the number of businesses, by size from 2013-14 to 2015-16

slide-14
SLIDE 14

Duggan, Goda, Jackson

  • Their regression table shows that the ACA reduced the

labor force by 349,190 on average 2014-15

  • Their regional-comparisons study is not designed to

measure labor market effects of the employer mandate

– The employer mandate is federal – The prevalence of 49ers is similar in Medicaid expansion states as in the other states

  • Their regional comparisons do not measure labor market

effects on near-elderly people

  • Need to add these effects to their 349,190