
SLIDE 1
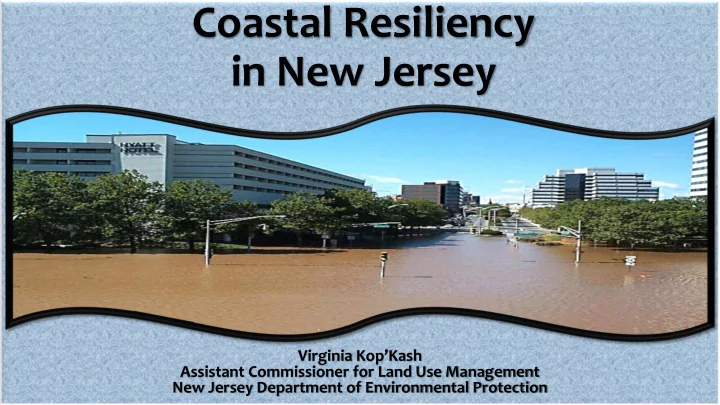
Coastal Resiliency in New Jersey
Virginia Kop’Kash Assistant Commissioner for Land Use Management New Jersey Department of Environmental Protection
in New Jersey Virginia KopKash Assistant Commissioner for Land Use - - PowerPoint PPT Presentation
Coastal Resiliency in New Jersey Virginia KopKash Assistant Commissioner for Land Use Management New Jersey Department of Environmental Protection How Did We Get Here? ? How Did We Get Here? How Did We Get Here? New Jerseys
Virginia Kop’Kash Assistant Commissioner for Land Use Management New Jersey Department of Environmental Protection
settlements were along navigable waterways
many of the State’s population centers are within flood hazard areas today
*from Disaster Resilience: A National Imperative, National Academy of Science, 2012
❖Enhanced resiliency = effectively anticipating disasters and planning in advance to reduce disaster losses instead of merely coping with the aftermath of an event
$ Complicated and expensive – requiring the
investment of time and resources prior to an event
Blue Acres Program:
municipalities
municipalities
Disaster Recovery
Blue Acres has spent more than $172 million
Since Superstorm Sandy, $1.216 billion have been spent on shore protection projects in New Jersey.
42% of New Jersey’s municipalities are coastal municipalities.
http://www.nj.gov/dep/cmp/docs/new
Coastal hazards include:
intensity and frequency
These hazards threaten
population, infrastructure, and habitat within our coastal areas
1. Geography
development.
Warmer air holds more moisture, which results in increased flooding and larger storm events, such as Superstorm Sandy.
would affect or submerge about 1% of New Jersey’s land along the coastline.
2100.