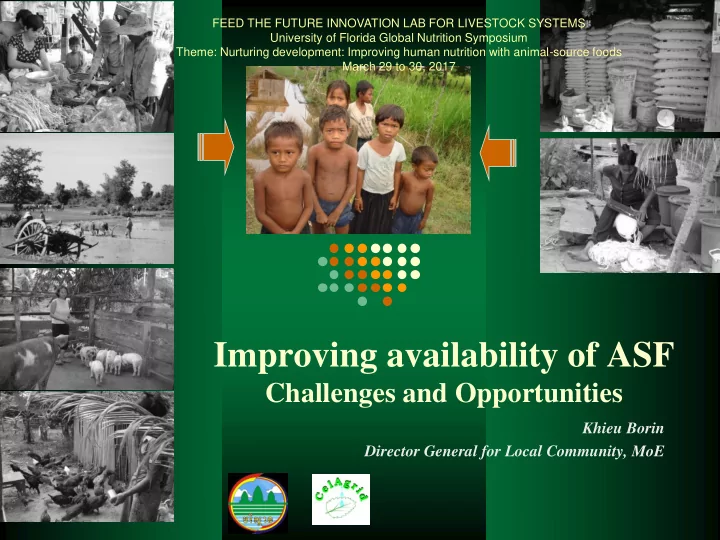
Improving availability of ASF Challenges and Opportunities Khieu - - PowerPoint PPT Presentation

improving availability of asf
SMART_READER_LITE
LIVE PREVIEW

Improving availability of ASF Challenges and Opportunities Khieu - - PowerPoint PPT Presentation

FEED THE FUTURE INNOVATION LAB FOR LIVESTOCK SYSTEMS University of Florida Global Nutrition Symposium Theme: Nurturing development: Improving human nutrition with animal-source foods March 29 to 30, 2017 Improving availability of ASF Challenges


slide-1
SLIDE 1

Improving availability of ASF

Challenges and Opportunities

Khieu Borin Director General for Local Community, MoE

FEED THE FUTURE INNOVATION LAB FOR LIVESTOCK SYSTEMS University of Florida Global Nutrition Symposium Theme: Nurturing development: Improving human nutrition with animal-source foods March 29 to 30, 2017

slide-2
SLIDE 2

CONTENT

  • Availability and accessibility to ASF
  • Composition of livestock farms
  • Structure and conditions of livestock

producers

  • Constraints and Opportunities in

livestock production

  • Taking home messages
slide-3
SLIDE 3

Consumers/farmers

AVAILABILITY ACCESSIBILITY SUSTAINABILITY AFFORDABILITY

slide-4
SLIDE 4

How can ASF improve?

Technology Producers’ interest

Demand in the market

Profitable Policy support Culture/tradition Capital Extension

  • Feed
  • Breed
  • Disease control
  • Market
  • Processing
slide-5
SLIDE 5

 90% keep 12.7±0.74 (5-23 heads) chickens,  67% keep 2.37±0.24 (1-5 heads) cattle,  46% keep 1.41±0.16 (1-5 heads) pigs,  24% kept 6.41±2.03 (1-40 heads) ducks,

and

 15% keep 0.50±0.06 (1-3 heads) buffalos.

slide-6
SLIDE 6

Structure of Livestock producers

  • Subsistent farmers
  • Self-sufficient farmers
  • Large farms
slide-7
SLIDE 7

Subsistent farmers

 Produce for own consumption and surplus

to local market

 low input-output as way to mitigate risk (diversification) and  use local available resources.

 They are declining – exit or pass to self-

sufficient.

 Change to medium or large scale  New alternative incomes – work at factories, construction

slide-8
SLIDE 8

Self-sufficient farmers

 Produce for market – contract

farming

 Require updated technologies  Credit for the expansion of their

business.

 Largely dependent on purchased

inputs

 Do other farm activities but more

focus on unique market commodity

slide-9
SLIDE 9

Large farm

 Sound higher bio-security practice

 Geographic concentration of waste

 technologies available to reduce environmental impact  expensive to return nutrients back to the soil

 Contract farming or/and own in-out

system

slide-10
SLIDE 10

Benefi nefit t from livesto tock ck producti tion

  • n

limited capacity to solve technical barriers

Limited access to quality vet services and extension Limited access to financial capital, agri- insurance and risk reduction tools

Poor access to market and information These have been almost always identified as the constraints of farmers however no systematic solutions provided?

slide-11
SLIDE 11

Diseases and solutions

Descriptions SMF LF

Vaccination, %

  • Salmonella
  • Pasteurella
  • CSF
  • FMD

Aujeszky

  • PRRS

16.2 35.1 94.5 56.8 27 73 30 30 90 40 30 90 Disease outbreaks, %

  • Salmonella
  • Pasteurella
  • CSF
  • FMD

Aujeszky

  • PRRS

91.4 26.5 20.6 23.5 11.8 8.8 55.9 60

  • 33.3
  • 33.3

83.3 Treatment, %

  • VAHWs
  • Private vet
  • Treat by themselves
  • Vet from contract farming

100 35.3 2.9 70.6

  • 100
  • 57.1

71.4

slide-12
SLIDE 12

Rice straw

  • 55% is removed for

animal feed

  • 45% is left in the field.
  • incorporate into the soil
  • Burning

Rice straw urea treatment Rice straw plus supplements

slide-13
SLIDE 13

13

Mean values of daily weight gain

50 100 150 200 250 300 350 400 450 FCL WS WSFCL Mean value of daily weight gain, g

slide-14
SLIDE 14

14

Growth rates of goats

slide-15
SLIDE 15

15

Mean values of daily weight gain

50 100 150 200 250 300 350 400 450 500 0.25 0.5 0.75 1 Daily weight gain, g Level of sun dried cassava foliage, % live weight, DM basis

slide-16
SLIDE 16

Performance of yellow cattle fed cassava pulp

Day 1 Day 39 Day 90 0.9 kg DWG/day

Composition kg/day Cassava pulp 13 Urea 0.078 Brewers grains 4.46 Rice straw 1.44 Minerals 0.039 Total DM 5.3

slide-17
SLIDE 17

Crickets farming

N0 Name %Dry matter %Moiste r %Crude Protein %Crude Ash %Crude fiber 1 Whole cricket meal 94.8 5.23 65.2 4.06 11.8 2 Leg cricket meal 96.8 3.21 67.5 5.24 13.2

slide-18
SLIDE 18

Technologies and adoption

Devendra and Leng 2011 reviewed 12 projects mostly from 1990s

  • 92% consider successful but “SCALING UP” is

the matter.

– Technologies are available but they are not beyond project lifetime.

Why could these introduced technologies be wider adopted?

slide-19
SLIDE 19

Messages to take home

Does cash income and/or nutrition drive

ASF from smallholders point of view?

What are key starting points when

smallholder farmers are the target?

What should be the effective and efficient

ways to promote livestock production?

How best can knowledge generated be

shared and used by farmers?

slide-20
SLIDE 20

Thanks