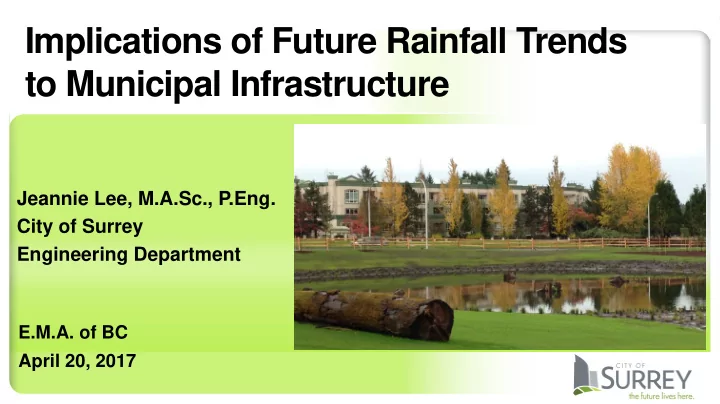

1 Implications of Future Rainfall Trends to Municipal Infrastructure Jeannie Lee, M.A.Sc., P.Eng. City of Surrey Engineering Department E.M.A. of BC April 20, 2017
2 Outline 1) Background 2) Rainfall Trending Study 3) Updated Rainfall IDF Study 4) Future Rainfall Projections 5) Going Forward
3 City of Surrey • Second largest city in BC • Area: 317 sq.km. • Population: over 500,000
4 City Bylaws & Policies
5 Growth & Development 2001 2015
6 Design Standards • 2004 Design Criteria Manual referenced 3 stations with period of record to 1999. • 1997 to present - City continued to collect data and expand network • IDF = Intensity-Duration-Frequency
7 Standard IDF Statistics
8 Rainfall Monitoring Stations 3 Primary Stations (Long-term stations) 3 New Stations (Subject to analysis for the first time) Additional Stations (for reference and gap-infilling)
9 Question… Since 1999, have rainfall trends and statistics changed?
1 0 Rainfall Studies To improve the City’s understanding of present-day & future rainfall: Rainfall Trending Study (July 2013) 1. IDF Update Study (October 2014) 2. Development of Future IDF Statistics (May 2015) 3.
1 1 Rainfall Trending Study Primary (Long-Term) Climate Stations only: Kwantlen Park (1962 - 2013) 1. Old Municipal Hall (1963 - 2013) 2. White Rock (1964 - 2013) 3. Data infilling used to complete the historic data sets.
1 2 Rainfall Trending Study Rainfall Temporal Variability
1 3 Rainfall Trending Study Rainfall Spatial Variability
1 4 Rainfall Trending Study MORE… Annual rainfall is increasing. Monthly rainfall is increasing. January is most significantly getting wetter. Increasing rainfall depths for shorter duration storms in the north. Increasing rainfall depths for long duration storms in the south. LESS… Number of dry days is decreasing.
1 5 Rainfall Trending Study MORE… Annual rainfall is increasing. Monthly rainfall is increasing. January is most significantly getting wetter. Increasing rainfall depths for shorter duration storms in the north. Increasing rainfall depths for long duration storms in the south. LESS… Number of dry days is decreasing.
1 6 IDF Update Study Stations for Updated IDF Analysis • Kwantlen Park (1962 -2013) • Municipal Hall (1963 - 2013) • White Rock (1964 - 2013) Additional New Stations for IDF Analysis • Chantrell Creek Elementary School (2000 - 2013) • Port Kells (2004 - 2013) • Semiahmoo Fish & Game Club (2000 - 2013)
1 7 IDF Update Study • Infilling of data gaps by correlation with relevant stations. • For consistency, data management and statistical analysis was maintained with the historic Environment Canada rainfall analysis.
1 8 2004 vs. Updated Updating of the Kwantlen Park Station IDF Statistics: ↑ Overall increase in IDF rainfall estimates for the varying durations and frequencies. (+ 3% to + 31% more).
1 9 2004 vs. Updated Updating of the Old Municipal Hall Station IDF Statistics: ↕ There is both a reduction and a significant increase in select IDF rainfall estimates. (- 7% to + 24%) ↑ Increased variability
2 0 2004 vs. Updated Updating of the White Rock Station IDF Statistics: ↕ There is both a reduction and a significant increase in select IDF rainfall estimates. (- 6% to + 44%) ↑ The impact of infilling the data series displayed significant changes in the rainfall statistics ranging from 1% to 23%.
2 1 2004 vs. Updated What does this mean to the IDF Statistics? ↑ Rainfall statistics have increased overall; up to 31% more ↑ Shorter duration events are showing larger increases ↑ Less frequent events are showing larger increases
2 2 2004 vs. Updated What does this mean to the IDF Statistics? ↑ Rainfall statistics have increased overall; up to 31% more ↑ Shorter duration events are showing larger increases ↑ Less frequent events are showing larger increases
2 3 Future Climate Change Projections ➢ 2030, 2050, and 2080 planning horizons at the Old Municipal Hall Station. Future projections have uncertainties such as: How will society address future global greenhouse gas emissions? 1. Progressing science defining atmospheric processes. 2. Influence on regional and local interactions between the atmosphere 3. and the earth.
2 4 Future Climate Change Projections Projection Process: 29 global circulation models (GCMs) to assess regional-scale climate 1. conditions. 4 future greenhouse gas (GHG) emission scenarios. 2. 3 methods to downscale from each GCM to the local Surrey condition. 3. Statistical analysis of the 350 projections . 4.
2 5 Future Climate Change Projections What comes from 350 future rainfall projections? A set of boundaries to contain expected future rainfall projections : 1. Lower band: maximum of the mean values from the 3 downscaling methods 2. Upper band: maximum of the 95 th percentile values of the 3 methods
2 6 Future Climate Change Projections EXAMPLE 2-YEAR RETURN PERIOD IDF PROJECTION FOR 2030’s AT SURREY MUNICIPAL HALL
2 7 Future Climate Change Projections Average increase in projected rainfall statistics: Planning Horizon Lower Band Upper Band (max. of 95 %’s) (max. of means) 2030’s 20% 72% 2050’s 35% 96% 2080’s 68% 154%
2 8 Climate Change Rainfall Adaptation ➢ Study is underway City adaptations may include: • Sizing of new infrastructure. • Level of service for existing drainage infrastructure. • New servicing standards. • On-lot servicing requirements.
In Summary • It’s getting wetter • Data gap infilling: up to 23% more • Updating the data: up to 31% more • Projections to 2080: up to 154% more • Adaptations are required for the future • Stay tuned
3 0 Questions? Jeannie Lee, M.A.Sc., P.Eng. JMLee@SURREY.CA
Recommend
More recommend