SLIDE 32 Barrett, C.B. et al. (2001a). “Non-farm income diversification and household livelihood strategies in rural Africa: Concepts, dynamics, and policy implications.” Food Policy, 26(4), 315-31. Barrett, C.B. et al. (2001b). “Income diversification, poverty traps and policy shocks in Coˆte d„Ivoire and Kenya.” Food Policy,26, 367– 384. Block, S. (2001). “The dynamics of livelihood diversification in post-famine Ethiopia.” Food Policy, 26: 333-350. Carter, M.R. (1997). “Environment, technology, and the social articulation of risk in West Africa agriculture.” Economic Development and Cultural Change, 45 (3), 557– 591. Ellis, F. (2000). “Rural livelihoods and diversity in developing countries.” Oxford University Press. Newyork Ellis, F. (1999). “Rural livelihood diversity in developing countries: evidence and policy implications.” Overseas Development Institute. Hoogeveen, J.G.M. (2001). “Income Risk, Consumption Security and the Poor.” Oxford Development Studies, 30(1), 105-121. Jalan, J. and Ravaillon, M. (1998). “Geographic poverty traps?” Institute for Economic Development. Discussion
- Paper. 86. Boston: Institute for Economic Development, Boston University.
Omamo, S.W. (1998). “Farm-to-market transaction costs and specialisation in smallscale agriculture explorations with a non-separable household model.” Journal of Development Studies. 35 (2). 152–163. Reardon, T. et al. (1994). “Links between nonfarm income and farm investment in African households: Adding the capital market perspective.” American Journal of Agricultural Economics, 76 (5). 1172–1176. Sen, A. (1975). “Employment, Technology and Development.” Oxford: Clarendon Press. Sahn, D.E. (1989). “Seasonal Variability in Third World Agriculture: The Consequences for Food Security.” Baltimore, MD: John Hopkins Press. SRDI, (2001). “Saline soil management.” Government of the people's republic of Bangladesh. Bangladesh national
- portal. Retrieved from http://www.srdi.gov.bd. Dated: 12 May, 2015.
REFERENCES
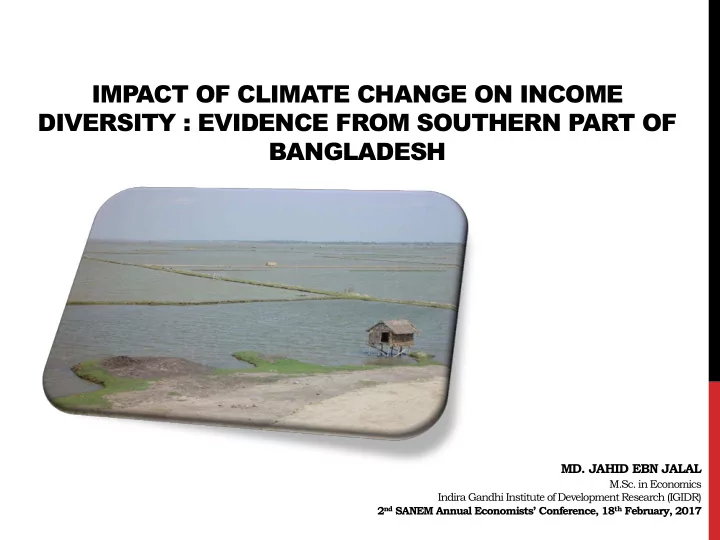
- Md. Jahid Ebn Jalal 2nd SANEM Annual Economists‟ Conference 18/02/2017