
SLIDE 1
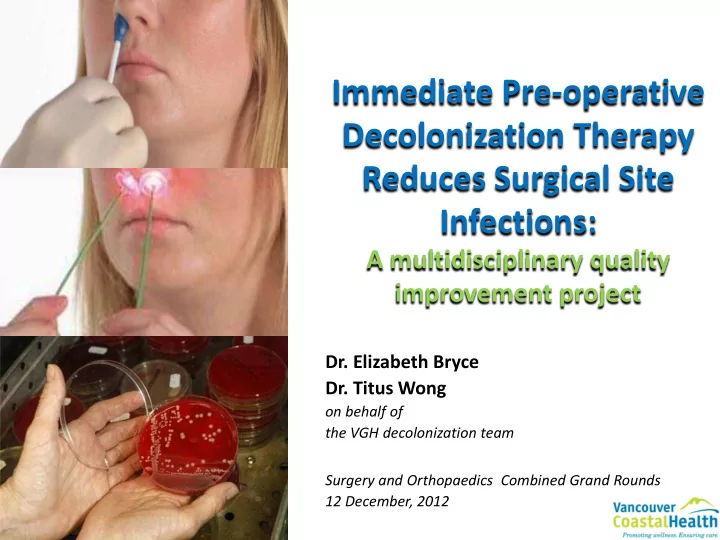
Immediate Pre-operative Decolonization Therapy Reduces Surgical Site Infections:
A multidisciplinary quality improvement project
- Dr. Elizabeth Bryce
- Dr. Titus Wong
- n behalf of
the VGH decolonization team Surgery and Orthopaedics Combined Grand Rounds 12 December, 2012
1