
SLIDE 1
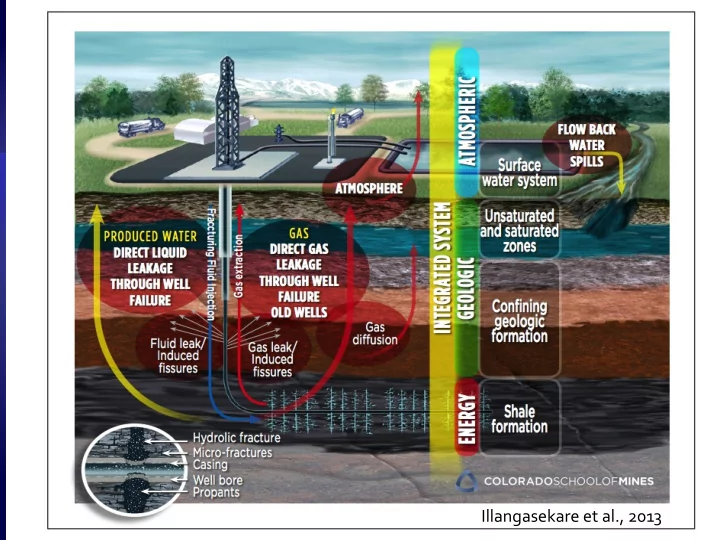
Illangasekare et al., 2013 CH 4 GWP 72 (20 yr) 25 (100 yr ) - - PowerPoint PPT Presentation
Illangasekare et al., 2013 CH 4 GWP 72 (20 yr) 25 (100 yr ) Petron, 2013 Le ak rate <1% ensures shale gas less of a GHG source than coal/oil (e.g. World Resource Institute, 2012) Fisher and Warpinski 2012 Kohlbecker, GSI 2011
Data from: Early and others (1996)