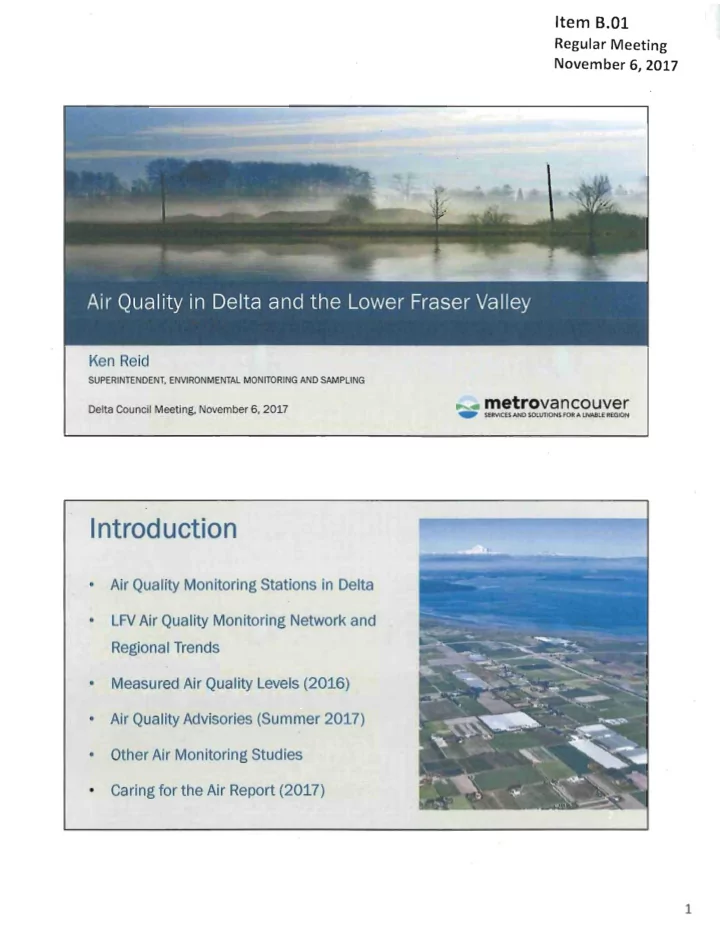
i
play

I ntrod uction . Air Quality Monitoring S tations in D elta LFV - PDF document

-- --- ~ Item B.01 Regular Meeting November 6, 2017 Ken Reid SUPERINTENDENT, ENVIRONMENTAL MONITORING AND SAMPLING 4 metrovancouver ........ Delta Council Meeting, November 6, 2017 SERVICES AND SOLUTIONS FOR A LIVABLE REGION I ntrod uction


  1. -- --- ~ Item B.01 Regular Meeting November 6, 2017 Ken Reid SUPERINTENDENT, ENVIRONMENTAL MONITORING AND SAMPLING 4 metrovancouver ........ Delta Council Meeting, November 6, 2017 SERVICES AND SOLUTIONS FOR A LIVABLE REGION I ntrod uction .• Air Quality Monitoring S tations in D elta • LFV Air Quality Monito r ing Network and Regional Trends • Measured Air Quality Levels (2016) • Air Quality Advisories (Summer 2017) • Other Air Monitoring S tudies Caring f or the Air Report (2017) • 1

  2. l.lot~ 11/ 1/ 2017 Air Quality Monitoring Stations in Delta RJehmond .- . .. - r, " Tilbury .. , Weslham v = • • o o-- , ~ .. . Ish lnd / ./ Bounda ry B.y / ROMn S North Delta Station • Established in 1987 • Fine particulate monitoring added in 2011 • Provides air quality and weather information for the community • Relocation in 2 018 . \. He ll in gs Reservoir 2

  3. 11/1/2017 Tsawwassen Station • Established in 2010 to fulfill Vancouver Fraser Port Authority (VFPA) com m itment - location recommended by a Technical Working Group • Funded by VFPA and operated by Metro Vancouver l, Pebble Hill Park • Provides air quality and weather information for the community Air Quality Monitoring Network • 29 stations collect air quality, visual air quality, and weather information • Metro Vancouver manages, operates and maintains the monitoring stations, equipment, and a centralized database • Monitoring network partners include federal, provincial and regional governments, as well as some industries 3

  4. 11/1/2017 Air Quality Reporting • Annual Reports • Comparison to Metro Vancouver's regional ambient air quality objectives • Air quality advisories and bulletins • Real - time and recent past data at ! . AirMap.ca Regional Air Quality Trends 6 5 1.2 1.0 4 0.8 0.6 3 0.4 0.2 o 4

  5. ~I .s~ w~s , s i! 1l 1 'f ~ ~ 11/1/2017 G rou nd-Level Ozone (0 3) - 2016 1 I I I l-Hour Objective Metro Vancouver a-Hour Objective (65 ppb) (82 ppb) ...... Maple Ridge r - 3 Agassiz ! Mission i Abbotsford Airport Chilliwack ! Hope Abbotsford -Mill lake Surrey East Port Moody ..... I ""l1lI Coqulttam Burnaby Mountain langley , --. . Pitt Meadows New Westminster N. Vancouver - 2nd Na rrows Richmond South ' -----, N. Vancouver-Mahon Park I , Nortl t Ilelta 'i j" Burnaby -Kensington Park , Burnaby South - Vancouver - Downtown , Richmond-Airport 10 10 30 40 50 60 70 80 90 • Maxi mum 8-Hour Rolling Average Concentration (ppb) Maximum i-Hour Average ;' t Fine Particulate (PM 2.5) - 2016 Abbotsford Airport Mission langley Hope Chilliwack Burnaby South Richmond South New Westminster Abbotsford- Mill lake Agassiz Pitt Meadows Richmond-Airport Surrey East I ' Noifl5 ' Dilt)l J I lsaWwassen·1 N. Vancouver-Mahon Park • Ma ximum 24 -Hour Burnaby-Kensington Park Rolling Av e rag e - N. Vancouver-2nd Narrows • Annual Average Port Moody Horseshoe Bay 10 15 20 25 30 3S concentration (",g/m') 5

  6. l ' awas ~ ~ ~ ~ ~ ~ ~ ~ s~il s~h' 1 F 1'.s 11/1/2017 Nitrogen Dioxide (N02) - 2016 I I Metro Vancouver Annual Objective ( 22 ppb) I Metro Vancouver i- Hour Objective (107 ppbll I No rth :: befta I • - ..... Richmond-Airport N. Vancouver-2nd Narrows Vancouver-Downtown New Westminster - Richmond South Burnaby-Kensington Park - Port Moody ,. N. Vancouver-Mahon Park Burnaby South - - Abbotsford- Mill lake Chilliwack - Surrey East Burnaby Mountain - Coquitlam - Maple Ridlle - Mission Pitt Meadows - • Ma ximum i-Hour Average (.' Agassiz - • Annual Average langley Abbotsford Airport Hope o so 100 10 20 30 40 60 70 80 90 110 Concentration (ppb) Sulphur Dioxide (S02) - 2016 Metro Vancouver Annual Objective (12 ppb) I I I Metro Vancouver 1- Ho ur Object ive (75 ppb) Chilliw ack PortMo ody I Burnaby-Capito I Hill Burnaby N orth • - N. Vancouver-Mahon Park N. Vancouver-2nd Narr ows lan gley Abbotsford Air port Burnaby-Kensington Park l1li I Tsa\ilWa . l1li Richmond So uth Vancouver-Downt own Abbotsford- Mill lake ~ r- Burnaby So uth • Maximum 1-Hour Average Pitt Mead ows • Annual Average port Richmond-Air 10 20 30 40 50 60 '70 80 90 Concentration (ppb) 6

  7. 11/1/2017 Summary of 2016 Air Quality • Regional ambient air quality has generally improved • No air quality advisories issued in 2016 • Two monitoring stations as well as several specialized studies in Delta have helped our understanding of air quality in Delta • Air quality in Delta generally compares favourably to other areas • In 2016, the Tsawwassen and North Delta stations met all air quality objectives 2017 - An unprecedented summer of advisories July 2017 Su M T W Th F Sa F Sa 1 1 2 2 3 4 5 ~ 7 8 9 9 10 11 12 13 14 15 10 11 12 13 14 15 16 IE 19 20 21 22 16 17 17 18 19 20 21 22 23 23 24 25 26 27 28 29 24 25 26 27 28 29 30 30 31 Ground Level Ozone Adviso~y Fine Particulate Matter Advisory III Fine Particulate Matter & Ground Level Ozone Advisory I " 7

  8. . ~ ~ Efe~ated .~ ~ 11/ 1/ 20 17 Summer 2017 in historical context 16 14 12 f(eason for Adv I sory 10 _ Efev:;ted Ozone _ PM "0 '0 _ Elevated ozone and PM Local Fire :u B .c E S 6 c:- o 4 '0 ,;: 2 o 6 D . Satellite view of a "good air" day 8

  9. 11/1/2017 Satellite vi~w of September 6 wildfire smoke I r .1 '. , .. , Summer 2017 • Summer 2017 heavily influenced by out-of-region wildfire smoke • Significant impacts to both particulate matter and ozone • Changing climate may increase wildfire frequency / severity 9

  10. 11/1/2017 ! Air Monitoring Studies • Particulate matter monitoring on Annacis Island • Detailed report on coal monitoring in Delta • Pilot near-road air quality monitoring Caring for the Air - 2017 • Climate actions • Transportation effects and solutions • Marine ECA update • Backgrounders • Regulatory activity • Open burning • Air quality review 10

  11. O. 1 ~ 11/1/2017 4.5% Sulphur Levels Allowed in Ma rine Fuel " ! t B EF OR E 20 12 JAN - JUL 20 2 AUG 2012 - D EC 2014 20 50 NINA RD Marine Emission Control Area update 11

Download Presentation
Download Policy: The content available on the website is offered to you 'AS IS' for your personal information and use only. It cannot be commercialized, licensed, or distributed on other websites without prior consent from the author. To download a presentation, simply click this link. If you encounter any difficulties during the download process, it's possible that the publisher has removed the file from their server.

Recommend


More recommend