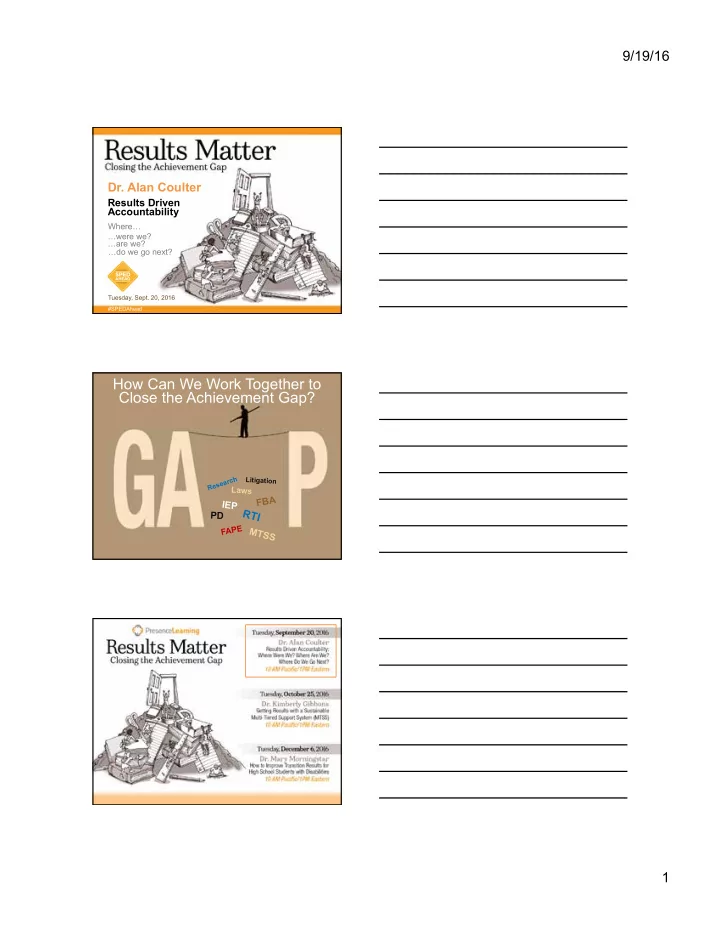
How Can We Work Together to Close the Achievement Gap? h c L i - - PDF document

how can we work together to close the achievement gap
SMART_READER_LITE
LIVE PREVIEW

How Can We Work Together to Close the Achievement Gap? h c L i - - PDF document

9/19/16 Dr. Alan Coulter Results Driven Accountability Where were we? are we? do we go next? new realities new choices Tuesday, Sept. 20, 2016 #SPEDAhead How Can We Work Together to Close the Achievement Gap? h c L i t


slide-1
SLIDE 1

9/19/16 1

  • Dr. Alan Coulter

…were we? …are we?

new realities new choices

Tuesday, Sept. 20, 2016

…do we go next?

Results Driven Accountability

#SPEDAhead

Where…

How Can We Work Together to Close the Achievement Gap?

P D

F A P E

RTI

MTSS IEP FBA

Laws

R e s e a r c h L i t i g a t i

  • n
slide-2
SLIDE 2

9/19/16 2

  • Dr. Alan Coulter
  • Over 25 years experience with U.S. OSEP

and state DOEs and LEAs on accountability issues

  • Served on the President’s Commission on

Excellence in Special Education

  • Director of Education Initiatives and an

Associate Professor at the Louisiana State University Health Sciences and Human Development Center.

  • Director of the TIERS Group (Teams

Intervening Early to Reach all Students)

#SPEDAhead

slide-3
SLIDE 3

9/19/16 3 Special Education: It's Time to Get Results!

We have limited time to get the best results for children with disabilities and their families

slide-4
SLIDE 4

9/19/16 4

Where Were We?

Part

1

Today’s Webinar

Where Were We?

Part

1

Where Are We?

Part

2

Today’s Webinar

Where Were We?

Part

1

Where Are We? Where Do We Go Next?

Part

2

Part

3

Today’s Webinar

slide-5
SLIDE 5

9/19/16 5

Where Were We?

Part

1

Results Driven Accountability Education for All Handicapped Children Act of 1975 Purposes of the Law:

  • 1. Free appropriate public education
  • 2. Assure rights
  • 3. Assist states and

locals to provide services

  • 4. Assess and assure

effectiveness “Everyone can agree with the objective stated in the title of this bill -- educating all handicapped children in our Nation. The key question is whether the bill will really accomplish that objective.”

President Gerald Ford, 1975

slide-6
SLIDE 6

9/19/16 6

39 Years of Special Education Law

Purpose 1 of the Law

“…to assure that all children with disabilities have available to them… a Free Appropriate Public Education which emphasizes special education and related services designed to meet their unique needs.”

Child Find

“All children residing in the state who are handicapped, regardless of the severity of their handicap, and who are in need of special education and related services are identified, located, and evaluated.”

Prevalence of Disabilities in the U.S.

1,000,000 2,000,000 3,000,000 4,000,000 5,000,000 6,000,000 7,000,000

First 25 Years of IDEA

1976 1980 1990 2000 2010

Child Find is working

slide-7
SLIDE 7

9/19/16 7

Purpose 2 of the Law

“…to assure that the rights of children with disabilities and their parents… are protected.”

1000 2000 3000 4000 5000 6000 7000 8000 2004-2005 2005-2006 2006-2007 2007-2008 2008-2009 2009-2010 2010-2011 2011-2012 New York Puerto Rico D.C. All Other States 2004 2006 2008 2010

Due Process Hearings Steadily Decreasing

Purpose 3 of the Law

“…to assist states and localities to provide for the educations of ALL children with disabilities.”

slide-8
SLIDE 8

9/19/16 8

Technical Assistance & Dissemination Network

Projects funded by the U.S. DOE

Technical Assistance & Dissemination Network

Projects funded by the U.S. DOE

Purpose 4 of the Law

“…to assess and assure the effectiveness

  • f efforts to educate all children

with disabilities.”

slide-9
SLIDE 9

9/19/16 9 What’s Your Altitude Today?

Altitude affects view of effectiveness of special education

Monitoring Compliance

“The Office of Special Education Services will be looking at 6,000 to 7,000 IEPs in the next few months to see whether any problems are developing.”

Ernest Boyer, Director, Bureau of Education for the Handicapped

Never Forget…

There are more than 755 process requirements in IDEA ’04 regulations.

slide-10
SLIDE 10

9/19/16 10 Checklist Mentality Going to Non Compliance Jail?

  • Corrective actions
  • Settlement agreements
  • Independent monitors

Historic Focus

Student Learning Outcomes Procedural Compliance

slide-11
SLIDE 11

9/19/16 11 IDEA-B: SPP Results Indicators

1: Graduation 2: Drop out 3: Statewide assessment 4: Suspension and expulsion 5: Educational environments 6: Preschool educational environments 7: Preschool outcomes 8: Parent involvement 14: Postsecondary outcomes 18: Resolution session agreements 19: Mediated agreements

Group 1

1: Graduation 2: Drop out 3: Statewide assessment 4: Suspension and expulsion 5: Educational environments 6: Preschool educational environments 7: Preschool outcomes 8: Parent involvement 14:Postsecondary outcomes 18: Resolution session agreements 19:Mediated agreements

Group 1 IDEA-B: SPP Results Indicators

Not Counted Towards Determination of Compliance

IDEA-B: SPP Compliance Indicators

These were the basis of state status determinations (up to 2014)

10: Disproportionate representation 11: Child Find 12: Early childhood transition 13: Secondary transition 15: Compliance findings 20: Timely and accurate data

Group 2

slide-12
SLIDE 12

9/19/16 12

2007 U.S. Dept. of Education Determinations on State Implementation

  • f IDEA Part B Determinations

Aggregate Performance on Selected Compliance Indicators

10 20 30 40 50 60 70 80 90 100

Transition B to C Complaints Timely Resolved Timely Evaluations Data

2005 2010

Getting Better!

What Could Have Been before RDA

Virgin Islands Puerto Rico

slide-13
SLIDE 13

9/19/16 13

Never Forget

Even if you could be in compliance with all 755, you would have NO ASSURANCE OF RESULTS.

Never Forget… What’s Missing?

“For too long we’ve been a compliance- driven bureaucracy when it come to educating students with disabilities.”

U.S. Secretary of Education, Arne Duncan

slide-14
SLIDE 14

9/19/16 14

  • Equal opportunity
  • Full participation
  • Independent living
  • Self-sufficiency

The Emphasis of I.D.E.A.

  • Improving educational RESULTS

and functional OUTCOMES for all children with disabilities

  • Ensuring that states meet…

the program requirements, with… emphasis on those most related to IMPROVING RESULTS

Focus of Monitoring Activities

Percentage of Public School Students with a ‘Proficient' Score

Students w/IEPs Other students reading math reading math

4th grade 10 14 30 35 8th grade 8 7 34 27 12th grade 12 6 40 26

National Assessment of Educational Progress, 2015

slide-15
SLIDE 15

9/19/16 15

Percentage of public school students with a ‘Proficient' score

National Assessment of Educational Progress, 2015

Students w/IEPs Other students reading math reading math

4th grade 10 14 30 35 8th grade 8 7 34 27 12th grade 12 6 40 26

Closing the Achievement Gap

Equal outcomes for students who have disabilities compared to students who do not

% of 8th Grade Students with Disabilities at or Above Achievement Levels

Data Source: OSEP

GAP

slide-16
SLIDE 16

9/19/16 16 U.S. Average Graduation Rate: 63%

Range: 83% to 28%

Employment Rate

10 20 30 40 50 60 70 80 90 100

2009 2010 2011 2012 2013

Less Than 40%

slide-17
SLIDE 17

9/19/16 17 Shift the Balance

Student Learning Outcomes Procedural Compliance

Shift the Balance

Student Learning Outcomes Procedural Compliance

slide-18
SLIDE 18

9/19/16 18 RDA = Effectiveness of Services

  • Monitor data to determine

if changes are needed

  • Maintain compliance

requirements

Remember This? Procedural Compliance Only

Several additional US Territories not shown

Washington, D.C.

Remember This? Procedural Compliance Only

N

  • t

i n 2 1 4

  • 1

5 ,

  • r

E v e r A g a i n

Several additional US Territories not shown

Washington, D.C.

slide-19
SLIDE 19

9/19/16 19

U.S. Dept. of Education Determinations

  • n State Implementation of IDEA

Part B Determinations - 2014

Meets Requirements (18) Needs Assistance (37) Needs Intervention (5)

Several additional US Territories not shown

U.S. Dept. of Education Determinations

  • n State Implementation of IDEA

Part B Determinations - 2015

Meets Requirements (21) Needs Assistance (36) Needs Intervention (3)

Several additional US Territories not shown

U.S. Dept. of Education Determinations

  • n State Implementation of IDEA

Part B Determinations - 2016

Meets Requirements (26) Needs Assistance (31) Needs Intervention (3)

Several additional US Territories not shown

slide-20
SLIDE 20

9/19/16 20 State Status Determinations Over Time

Meets Requirements Needs Assistance Needs Intervention

2014 18 37 5 2015 21 36 3 2016 26 31 3

Not Entirely Accurate

Remember the Concept of Altitude!

Three Guiding Principles of RDA

  • 1. Align Your Efforts

Focus your resources on what is most likely to reduce the achievement gap

slide-21
SLIDE 21

9/19/16 21

  • 2. Reduce the Reporting Burden

Document what is minimally required by law

  • 3. Monitor Data Sources and Measures

How students with disabilities perform compared to their peers

Three Results Indicators

ü Graduation rates ü Assessments ü Post-secondary

  • utcomes

OSEP’s Focus for RDA

slide-22
SLIDE 22

9/19/16 22 State Systematic Improvement Plan

Indicator #17 describes how states are supporting school districts in improving results Where Are We?

Part

2

Results Driven Accountability

2 1 3 4 5

Five Step Process

slide-23
SLIDE 23

9/19/16 23 DATA Data Analysis

  • Multiple data sources

Data Analysis

  • Multiple data sources
  • Disaggregated data
slide-24
SLIDE 24

9/19/16 24 Data Analysis

  • Multiple data sources
  • Disaggregated data
  • Data quality

Data Analysis

  • Multiple data sources
  • Disaggregated data
  • Data quality
  • Compliance data

Data Analysis

  • Multiple data sources
  • Disaggregated data
  • Data quality
  • Compliance data issues
  • Trends and patterns
slide-25
SLIDE 25

9/19/16 25

Special Education Services, Alabama Department of Education State Performance Plan - Annual Performance Report

2012 - 2013

Reading

2012 - 2013

Math

Participation Rate

99.69% 99.54%

Proficiency

48.67% 47.25%

Alabama

Students with Disabilities

Alabama Proficiency in Reading & Language Arts for Students w/IEPs

2010 to 2011 2011 to 2012 2012 to 2013

Grade 3 51.5 55.1 53.4 4 51.5 51.7 54.3 5 50.9 52.1 52.6

6

49.5

48.5 48.8

7

43.3

44.2

48.1

8

34.4 35.2

37.2

9 35.8 35.8 44.8 Total 45.7 46.5 48.6

Alabama 2011 to 2012 ARMT Reading Proficiency Score Comparison

0 ¡ 20 ¡ 40 ¡ 60 ¡ 80 ¡ 100 ¡ 6th ¡ 7th ¡ 8th ¡

Proficiency

Grade

General Education Students Students with Disabilities

Special Education Services, Alabama Department of Education State Performance Plan - Annual Performance Report

GAP

slide-26
SLIDE 26

9/19/16 26

Alabama 2012 to 2013 ARMT Reading Proficiency Score Comparison

0 ¡ 20 ¡ 40 ¡ 60 ¡ 80 ¡ 100 ¡ 6th ¡ 7th ¡ 8th ¡

Proficiency

Grade

General Education Students Students with Disabilities

Special Education Services, Alabama Department of Education State Performance Plan - Annual Performance Report

GAP

Special Education Graduation

Diploma Rates 2009 to 2010

Cesar D’Agord, 2013

65.4% 51.4% 40.7% 38.5% 32.5% 30.4% 28.2% 25.8% 24.6% 18.3%

38.0%

0% 10% 20% 30% 40% 50% 60% 70% Guam Hawaii American Samoa Northern Marianas Washington Alaska California Idaho Oregon Nevada U.S. and

  • utlying

areas

Source: Section 618 Data

Idaho

Special Education Graduation Rate Trends (comparing 2005 to 2009)

Cesar D’Agord, 2013 Source: Section 618 Data

32.5%

10.1% 3.6% 3.2% 2.8% 1.8%

  • 0.5%
  • 1.3%
  • 7.0%
  • 14.6%

4.9%

  • 20%
  • 10%

0% 10% 20% 30% 40% Washington Guam Alaska American Samoa Nevada Oregon Idaho California Hawaii Northern Marianas U.S. and

  • utlying

areas

Idaho

slide-27
SLIDE 27

9/19/16 27 Special Education Graduation Rate Trends (comparing 2005 to 2009)

Cesar D’Agord, 2013 Source: Section 618 Data

32.5%

10.1% 3.6% 3.2% 2.8% 1.8%

  • 0.5%
  • 1.3%
  • 7.0%
  • 14.6%

4.9%

  • 20%
  • 10%

0% 10% 20% 30% 40% Washington Guam Alaska American Samoa Nevada Oregon Idaho California Hawaii Northern Marianas U.S. and

  • utlying

areas

Washington Idaho

Special Education Graduation Rate Trends (comparing 2005 to 2009)

Cesar D’Agord, 2013 Source: Section 618 Data State 5-year trend Graduation Rate Special Education Students National Rank 5-year trend Washington

32.5% 1

Guam

10.1% 14

Alaska

3.6% 33

American Samoa

3.2% 35

Nevada

2.8% 36

Oregon

1.8% 40

Idaho

  • 0.5%

44

California

  • 1.3%

46

Hawaii

  • 7.0%

52

Northern Marianas

  • 14.6%

57

U.S. and outlying areas

4.9% Lowest rank = 57

Note: Information from RMI, FSM and Palau is not included on 618 data tables.

DATA

INFRASTRUCTURE

slide-28
SLIDE 28

9/19/16 28

Although not all change is improvement, all improvement is change.

The First Law of Improvement and Sustaining Results

Every system is perfectly designed to achieve exactly the results it gets

Infrastructure Analysis: OSEP’s Definition

Does the system have results-building capacity?

  • Finance
  • Standards
  • Professional

development

  • Technical

assistance

  • Accountability

Looks at how states can be organized to get better results

slide-29
SLIDE 29

9/19/16 29 Oregon DOE Reorganization

Oregon’s Office of Learning is an example of how to reorganize and integrate programs to get better results.

DATA

INFRASTRUCTURE

SIMR State Identified Measurable Result (SIMR)

  • Outcomes-focused
  • Measurable
  • Single or cluster
slide-30
SLIDE 30

9/19/16 30 SIMR

  • Graduation AK, DC, FL, GA,

MN, MT, NC, ND, NJ, PA

  • Reading/Literacy AR, AS,

AZ, CNMI, CO, CT, DE, FSM, GU, HI, IA, ID, IL, IN, KS, LA, MI, MS, NE, NV, NM, NY, OH, OH, OR, Palau, SC, SD, TX, VI, WA, WI, WY

  • Math KY, MD, ME, PR,

RI, UT, VT

Source: IDEA Data Center

SIMR

Reading & Math CA, MO

Source: IDEA Data Center

Early Childhood Outcomes MA, NH Post-School Outcomes AL, BIE

Broad (25 States) Limited (31 States) ??? (3 States) ??? (3 States)

Source: IDEA Data Center

SIMR Scope

Source: IDEA Data Center

slide-31
SLIDE 31

9/19/16 31 State-Identified Measurable Result (SIMR)

Graduation Reading/Literacy Math Others

Source: Adapted from IDEA Data Center presentation

  • Disability
  • Ethnicity
  • Gender
  • ELL
  • Poverty
  • Grades
  • Ages

Child-Level Variations in SIMRs

Focus, Focus, Focus!

How Do We Hold Ourselves Accountable?

slide-32
SLIDE 32

9/19/16 32

Go to your state’s DOE web site to find your SSIP

Find Your State’s SSIP

California’s Board of Education SSIP

It’s more than 30 pages!

slide-33
SLIDE 33

9/19/16 33

DATA

INFRASTRUCTURE

SIMR

IMPROVEMENT STRATEGIES Coherent Improvement Strategies

  • Use all your resources

to get better results

  • Data analysis leads

to area of focus

  • Must clearly define

improvement area

Project “Closing the Gap”

Alabama DOE program improves understanding

  • f how feeder patterns impact results
slide-34
SLIDE 34

9/19/16 34

65% of students w/IEPs had gains on STAR Assessments

Alabama Project “Closing the Gap” Improvements

Results suggest that a different way of doing things can result in significant improvements in student outcome Use implementation drivers to make certain that your improvement strategies stick

The Key to Implementation Science

Alabama’s Implementation Strategies

  • Instructional coaching
  • Effective co-teaching
  • Safe and civil schools
  • Linkages between special educators
slide-35
SLIDE 35

9/19/16 35

DATA

INFRASTRUCTURE

SIMR

IMPROVEMENT STRATEGIES

THEORY OF ACTION AL’s Theory of Action (Hypothesis) If…

Effective instruction

And if…

Appropriate services

Then…

Positive

  • utcomes

DATA

INFRASTRUCTURE

SIMR

IMPROVEMENT STRATEGIES

THEORY OF ACTION

slide-36
SLIDE 36

9/19/16 36

Where Do We Go Next?

Part

3

Results Driven Accountability What’s in it for me?... possibilites?... potential?... RDA & SSIP

  • Target groups of students

identified in SSIP

  • Use OSEP’s research-based

methodology

  • Follow principles of

implementation science

RDA Opportunities In Your School District

slide-37
SLIDE 37

9/19/16 37 Look at your state’s SIMR Look at your state’s SIMR

Is this a priority for me?

Look at your state’s SIMR

Is this a priority for me? Is this a priority for my school?

slide-38
SLIDE 38

9/19/16 38 Look at your state’s SIMR

Is this a priority for me? Is this a priority for my school? Is this a priority for my district?

Your Results Suggest a Focus – an Identified Measurable Result (IMR)

Enablers/Barriers of Your Infrastructure

slide-39
SLIDE 39

9/19/16 39

Six months after making a New Year’s resolution only about 8% of the people have followed through.

Initiative Overload Other Initiatives for Linking

Identified Measurable Result as an Economic Engine for Your Community

slide-40
SLIDE 40

9/19/16 40

Immediate Past Experience in Improving Results

Things often don’t go well when everyone doesn’t buy in. What resources can we bring to bear to focus on results for our SSIP?

Consider Evidence-Based Practices

Which ones? Do we have the staff to implement them? Can we ensure fidelity and get results?

Consider Evidence-Based Practices

slide-41
SLIDE 41

9/19/16 41 Communication Breakdown

School District State

Student Achievement Data Errors and lags in data transmission are barriers to evaluating the effectiveness of programs. D A T A

Commitment to Continuing Professional Learning

slide-42
SLIDE 42

9/19/16 42 What commitments are needed to sustain efforts to improve results?

Commitment Needed from Students and Adults

Adult absenteeism negatively impacts plans to get better results and to close the achievement gap

Acknowledgement of Long Term Efforts

It takes 3-7 years to achieve data-proven sustainable results

slide-43
SLIDE 43

9/19/16 43 Involvement of District Leaders

Administrators must be deeply involved in developing and implementing plans

Stakeholder Involvement

Engage the entire academic community: teachers, administrators, staff, and parents.

Attitude Adjustment toward Special Education

General education must have an inclusive view. All students can make progress.

slide-44
SLIDE 44

9/19/16 44

#SPEDAhead

new realities new choices

Q & A

#SPEDAhead

new realities new choices

Where do we begin with RDA?

#SPEDAhead

new realities new choices

What data do we need to be using to set our students up for success?

slide-45
SLIDE 45

9/19/16 45

#SPEDAhead

new realities new choices

With so much emphasis placed on result-based achievement, how can we, as therapists, translate this achievement in to actual real life learning and success?

#SPEDAhead

new realities new choices

What is the best evidence based practice for measuring results- how do states measures of accountability compare?

#SPEDAhead

new realities new choices

What is the best way to show student progress?

slide-46
SLIDE 46

9/19/16 46

#SPEDAhead

new realities new choices

What data system best shows student progress?

#SPEDAhead

new realities new choices

What strategies are most effective in closing the achievement gap for students with special needs?

#SPEDAhead

new realities new choices

Research currently trashes remediation as a way to close the achievement gap. What's up?

slide-47
SLIDE 47

9/19/16 47

#SPEDAhead

new realities new choices

Interested in Becoming an Online Provider?

Refer your colleagues:

plearn.co/apply-to-pl

PresenceLearning has

  • pportunities (FT & PT) for:
  • SLPs
  • OTs
  • School Social Workers
  • School Psychologists

Available On Demand Available On Demand

slide-48
SLIDE 48

9/19/16 48

A Certificate of Attendance will be sent to attendees who have:

  • Watched the live webinar in its entirety
  • Completed the post-webinar quiz with a passing score of 80%
  • Submitted the feedback survey

To receive CE credit:

  • ASHA members: No action necessary if your registration

included valid ASHA membership ID & contact information

  • NASP members: Your Certificate of Attendance has the

required information for self-reporting Questions? Email SPEDforum@presencelearning.com Look for follow-up email soon with the link to webinar recording and associated materials

PresenceLearning.com PresenceLearn PresenceLearning

THANK YOU

new realities new choices

#SPEDAhead