
SLIDE 1
Highlights from ARGO-YBJ
- G. Di Sciascio
Highlights from ARGO-YBJ G. Di Sciascio INFN Sez. Roma Tor Vergata - - PowerPoint PPT Presentation
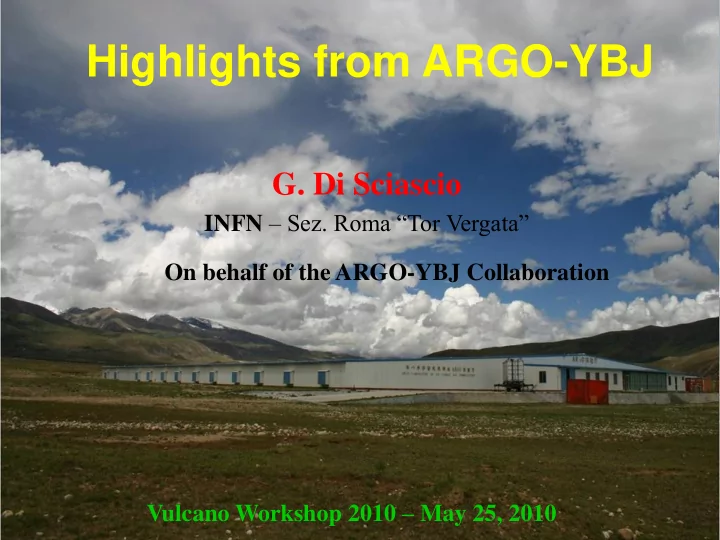
Highlights from ARGO-YBJ G. Di Sciascio INFN Sez. Roma Tor Vergata On behalf of the ARGO-YBJ Collaboration Vulcano Workshop 2010 May 25, 2010 The ARGO-YBJ experiment An unconventional EAS-array exploiting the Longitude 90 31
Vulcano Workshop 2010
2
Longitude 90° 31’ 50” East Latitude 30° 06’ 38” North 90 Km North from Lhasa (Tibet) An unconventional EAS-array exploiting the full coverage approach at very high altitude, with the aim of studying
The Yangbajing Cosmic Ray Laboratory
VHE γ-Ray Astronomy Gamma Ray Burst Physics Cosmic Ray Physics
4300 m above the sea level
Vulcano Workshop 2010
3
INFN and Dpt. di Fisica Università, Lecce INFN and Dpt. di Fisica Universita’, Napoli INFN and Dpt. di Fisica Universita’, Pavia INFN and Dpt di Fisica Università “Roma Tre”, Roma INFN and Dpt. di Fisica Univesità “Tor Vergata”, Roma INAF/IFSI and INFN, Torino INAF/IASF, Palermo and INFN, Catania IHEP, Beijing Shandong University, Jinan South West Jiaotong University, Chengdu Tibet University, Lhasa Yunnan University, Kunming ZhengZhou University, ZhengZhou Hong Kong University, Hong Kong
Vulcano Workshop 2010
4
Single layer of Resistive Plate Chambers (RPCs) with a full coverage (92% active surface) of a large area (5600 m2) + sampling guard ring (6700 m2 in total)
time resolution ~1-2 ns (pad) space resolution = strip
10 Pads (56 x 62 cm2) for each RPC 8 Strips (6.5 x 62 cm2) for each Pad 1 CLUSTER = 12 RPCs
78 m 111 m 99 m 74 m (5.7 7.6 m2)
Gas Mixture: Ar/ Iso/TFE = 15/10/75 HV = 7200 V Central Carpet:
130 Clusters 1560 RPCs 124800 Strips
Vulcano Workshop 2010
5
Recording the counting rates (Nhit ≥1, ≥2, ≥3, ≥4) for each cluster at fixed time intervals (every 0.5 s) lowers the energy threshold down to ≈ 1 GeV. No information on the arrival direction and spatial distribution of the detected particles.
Detection of Extensive Air Showers (direction, size, core …) Coincidence of different detector units (pads) within 420 ns Trigger : ≥ 20 fired pads on the central carpet (rate ~3.6 kHz)
INDIPENDENT DAQ
Number of fired Strips
Space pixel: 7 62 cm2 (single strip) Time pixel: 56 62 cm2 (8 ORed strips = 1 Pad) Time resolution: ≈ 1 ns The size of pixels, the time resolution and the full coverage allow reconstruction with unprecedent details
Vulcano Workshop 2010
7
Vulcano Workshop 2010
8
Vulcano Workshop 2010
9
Geomagnetic Field: positively charged particles are deflected towards the West. Ion spectrometer The observation of the Moon shadow can provide a direct check
Cosmic rays are hampered by the Moon Deficit of cosmic rays in the direction of the Moon
) ( 6 . 1 TeV E Z
Moon diameter ~0.5 deg
Size of the deficit Position of the deficit Angular Resolution Pointing Error Energy calibration West displacement
Vulcano Workshop 2010
10
N > 100
55 s.d. 9 standard deviations / month PSF of the detector 3200 hours on-source
θ < 50°
The deficit surface is the convolution of the PSF
Vulcano Workshop 2010
11
Measured angular resolution Measured EW displacement
Vulcano Workshop 2010
12
Displacement of the Sun shadow correlates with the SMMF
The displacement of the Sun shadow is a good measurement of the IMF, especially in a this particular quiet phase between 23th and 24th cycles. Sun at maximum → shadow is washed out Sun at minimum → good shadow & SMF symmetric between NS EW shift due to GMF NS shift due to IMF
Vulcano Workshop 2010
13
Vulcano Workshop 2010
14
Using data on Moon shadow, limits on antiparticle flux can be derived. Protons are deflected towards West, antiprotons are deflected towards East
→ 2 symmetric shadows expected.
If the displacement is large and the angular resolution small enough we can distinguish between the 2 shadows. If no event deficit on the antimatter side is observed an upper limit on antiproton content can be calculated.
Vulcano Workshop 2010
15
Vulcano Workshop 2010
16
Measurement of the light-component (p+He) spectrum of primary CRs in the energy region (5 – 250) TeV via a Bayesian unfolding procedure CNO < 2%
ARGO data agree with CREAM results
Evidence that the proton spectrum is flatter than in the lower energy region CREAM p+He EAS-TOP + MACRO Horandel p+He CREAM p CREAM He
ARGO preliminary
Vulcano Workshop 2010
17
Vulcano Workshop 2010
18
Cosmic rays excess 0.06% 0.1% N PAD > 40
Proton median energy 2 TeV
Smoothing radius = 5
r.a.=0 r.a.=360
Vulcano Workshop 2010
19
Proton median energy 2 TeV
He Heliotail tail Ge Gemi minga Ga Galacti tic Pl Plane
~6 ·10-4 ~4 ·10-4 Proton median energy 10 TeV
Multiple explanations were proposed:
Salvati & Sacco, A&A 485 (2008) 527 Drury & Aharonian, Astrop. Phys. 29 (2008) 420.
Salvati, A&A 513 (2010) A28
Tail-in Loss-cone Cygnus region
ARGO-YBJ DATA: 2008 and 2009
Vulcano Workshop 2010 20
Vulcano Workshop 2010
21
Fit function:
Agree with diffusion model: larger amplitude for higher energy.
0.7 TeV 1.5 TeV 3.9 TeV
Vulcano Workshop 2010 22
Vulcano Workshop 2010
23
Crab Mrk421
Mean = -9.3 2.1 10-3 Sigma = 1.008 0.002
Vulcano Workshop 2010
24
dN/dE = (3.73 0.80) ·10-11 · E –2.67 0.25 ev cm –2 s –1 TeV –1
N PAD Events /day Emed (TeV) 40 – 100 128 24 0.85 100 – 300 17.9 6.3 1.8 > 300 9.2 2.3 5.2
~50 % Crab/year
NO selection NO γ/h discrimination Absolute measurement
Vulcano Workshop 2010
25
Total significance: 12 s.d. in ~800 days
Different flares observed by ARGO-YBJ in TeV range
Full DAQ TEST data
Mrk421 is characterized by a strong flaring activity both in X-rays and in TeV γ–rays. Swift (15-50 keV)
Vulcano Workshop 2010
26
Mrk421 ASM / RXTE
ARGO started recording data with the full central carpet during the X-ray flare of Mrk421 in July 2006 Commissioning Phase Evidence for TeV emission in coincidence with a X-ray flare
Npad > 60 Eγ
50 ~1.6 TeV, Eγ mode ~500 GeV
days 187-245 (110 hours) R.a. (deg)
δ (deg)
Flux 3-4 Crab
Vulcano Workshop 2010
27
NPAD > 100
ARGO ASM/RXTE days from 1-1-08
10 days average
Correlation coefficient = 0.64
Gamma Rays vs X-rays
Vulcano Workshop 2010
28
Power law spectrum + EBL absorption :
EBL from Primack et al. AIP conf. Proc. 745, 23, 2005
Integral flux (E > 1 TeV) 4.9 2.0 10-11 ev cm –2 s –1
2008 days 41 – 180: when the source was in active state
Vulcano Workshop 2010
29
GASP- WEBT SWIFT RXTE SWIFT SuperAGILE AGILE MAGIC VERITAS
A set of simultaneous measurements covering 12 decades from optical to TeV energies was performed during the flaring activity in first half of June 2008 data from:
GASP-WEBT (R-band; May 24 to June 23) SWIFT (UVOT & XRT; June 12-13) AGILE (E > 100 MeV; June 9-15) MAGIC and VERITAS (E> 400 GeV; May 27 - June 8)
in Donnarumma et al., ApJ 691 L13 (2009) complemented by publicy-available data from RossiXTE/ASM (2-12 keV) and Swift/BAT (15-50 keV).
No VHE data after June 8
the moonlight hampered the Cherenkov telescopes measurements ! 2 flaring episodes were reported: June 3-8 and June 9-15
Vulcano Workshop 2010
30
Expected from theoretical SED
~18 h on source
NPAD > 100 3 days average June 5-7, 3.0 June 11-13, 4.2 1 day average
Vulcano Workshop 2010
31
EBL from Raue, M. & Mazin, D., 2008, Int. J. Mod. Phys. D17, 1515
The spectrum slope is consistent with that measured by Whipple in 2000/2001
the relation spectral index – flux is a long term property of the source. The integral flux above 1 TeV during June 11-13 is ~6 Crab units:
Vulcano Workshop 2010
32
VERITAS reported similar
The flux exceeded 3 Crab units for the duration of the
(16 Feb.) is >10 Crab units. The flux measured by ARGO is consistent with VERITAS evaluation. For the first time an EAS- array observed a TeV flare at 5σ on a daily basis. 16-18 Feb. 16 Feb. 17 Feb. 18 Feb. ARGO observed a strong TeV γ-ray flare from Mrk421 during 16-18 Feb. 2010 at 6σ.
Vulcano Workshop 2010
33
confirmed by HESS and VERITAS.
index is -2.1 up to 20TeV without cutoff.
at about 14 TeV and its flux is higher than HESS result.
data seems to support the Milagro spectrum.
Vulcano Workshop 2010
34
VERITAS
Milagro Fermi LAT
ARGO-YBJ
Tibet ASγ R=1.5 deg
No detection at 5σ, but with 2 years data ARGO is observing some signals from 2 TeV sources.
Vulcano Workshop 2010
35
Crab Nebula spectrum in agreement with other measurements Continuous monitor of Markarian 421 All sky survey Limits on 1-100 GeV fluence from GRBs
Large & Medium scale anisotropies Solar physics p-p cross section Limit on antiproton flux Light component spectrum measurement Multicore EAS with large transverse momentum
Vulcano Workshop 2010
36
Vulcano Workshop 2010
37
Vulcano Workshop 2010
38
No evidence of coincident signal over the GRB T90 duration In stacked analysis no evidence for any integral effect
GRBs with known redshift
Fluence upper limits (99% c.l.) obtained with differential spectral indexes ranging from the value measured by satellites to 2.5 .
Vulcano Workshop 2010
39
Idea: measurement of shower rate at fixed energy as a function of the zenith angle
Where is not the p interaction lenght mainly because of inelasticity, shower fluctuations and detector resolution. = k
int , where k is determined by MC and
depends on:
int p-Air (mb)=2.4 104 / int(g/cm2)
h0 q Data Full MC
Vulcano Workshop 2010
40
Extending the energy range with the analog readout Vulcano Workshop 2010
41
Vulcano Workshop 2010
42
Vulcano Workshop 2010
43
The higher the energy the lower the West displacement induced by the Earth magnetic field.