
SLIDE 1
1
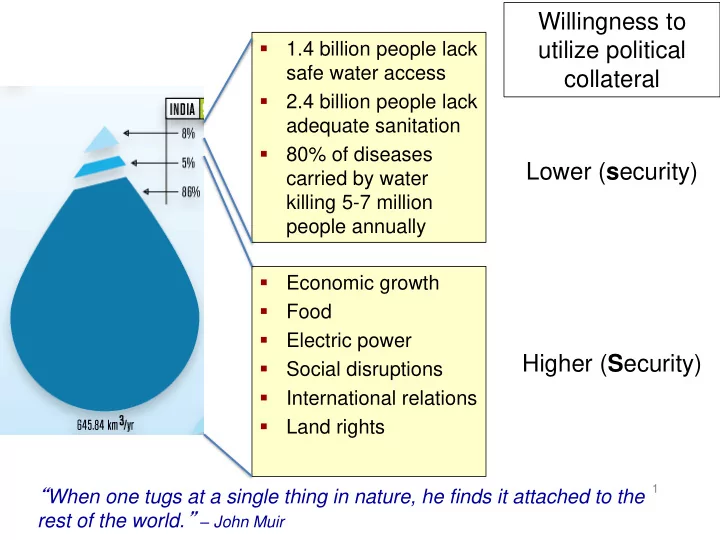
- 1.4 billion people lack
safe water access
- 2.4 billion people lack
adequate sanitation
- 80% of diseases
carried by water killing 5-7 million people annually
Willingness to utilize political collateral Lower (security)
- Economic growth
- Food
- Electric power
- Social disruptions
- International relations
- Land rights
Higher (Security)
“When one tugs at a single thing in nature, he finds it attached to the rest of the world.” – John Muir