
SLIDE 1
HIGH GRADE GOLD MINE IN THE USA Kerr Mines Corporate Presentation - - PowerPoint PPT Presentation
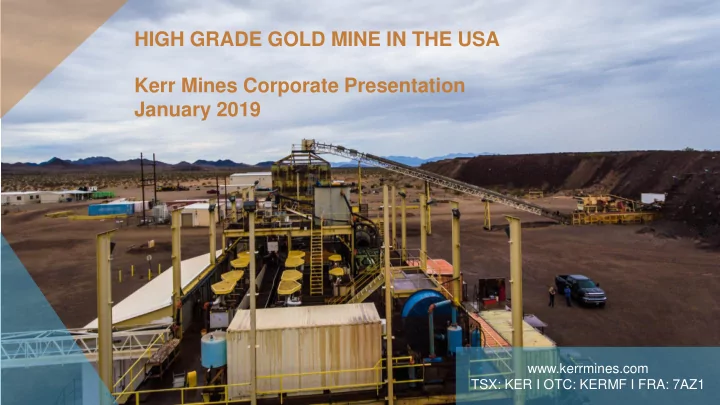
HIGH GRADE GOLD MINE IN THE USA Kerr Mines Corporate Presentation January 2019 www.kerrmines.com TSX: KER I OTC: KERMF I FRA: 7AZ1 FORWARD-LOOKING STATEMENTS This presentation contains forward-looking information, including statements
This presentation contains forward-looking information, including statements regarding: the proposed timing, schedule, and costs for restarting production at the Copperstone Mine, rate of production, expected cash costs, expected increase in milling capacity, exploration potential at the Copperstone Mine, proposed debt restructuring and financing, share capitalization and director ownership,. These forward-looking statements entail various risks and uncertainties that could cause actual results to differ materially from those reflected in these forward-looking statements. Such statements are based on current expectations, are subject to a number of uncertainties and risks, and actual results may differ materially from those contained in such statements. These uncertainties and risks include, but are not limited to, the strength of the economy; the price of gold; operational, funding, and liquidity risks; the degree to which mineral resource and mineral reserve estimates are reflective of actual mineral resources and mineral reserves; and the degree to which factors which would make a mineral deposit commercially viable are present; assumptions with respect to the cost and availability of labour for the restart of operations are correct,; results of exploration and validity of geological models; the risks and hazards associated with underground operations, and any specific risks or assumptions set out or referenced in this presentation. Risks and uncertainties about Kerr Mines Inc. and its business are more fully discussed in its disclosure materials, including the annual information form, technical reports, financial statements and MD&As, filed with the securities regulatory authorities in Canada and available at www.sedar.com and readers are urged to read these
statements unless required by law. This presentation includes certain non-IFRS measures, including cash costs on a per gold ounce basis. Cash costs per gold ounce are defined as costs of production (including refining costs) divided by the total number of gold equivalent ounces produced. The Company reports total cash costs on a production basis. In the gold mining industry, these are common performance measures but do not have any standardized meaning, and are non-GAAP measures. As such, they are unlikely to be comparable to similar measures presented by other issuers. In reporting cash costs per gold ounce, the Company follows the recommendations of the Gold Institute standard. The Company believes that, in addition to conventional measures, prepared in accordance with IFRS, certain investors use this information to evaluate the Company’s performance and ability to generate cash flow. Accordingly, it is intended to provide additional information and should not be considered in isolation or as a substitute for measures of performance prepared in accordance with IFRS. Technical information in this presentation has been reviewed and approved by Michael R. Smith P. Geo., who is a qualified person that is independent of the Company, as defined in National Instrument 43-101. 2
3
Claudio Ciavarella – Chief Executive Officer & Director Fahad Al Tamimi - Chairman
▪ A businessman with global investment activities ▪ Former President and CEO of SaudConsult, the largest engineering firm in Saudi Arabia ▪ Investments in mining
Peter Damouni - Director
▪ Over 17 years of experience in investment banking and capital markets, with expertise in mining and oil and gas ▪ Led equity and debt financings valued over $5 billion
Ayman Arekat - Director
▪ Over 35 years of banking, finance and investment experience ▪ Previously with Chase Manhattan Bank, Merrill Lynch, Deutsche Bank, Investcorp and Abraaj Capital
James McVicar - Director
▪ Over 20 years of specialized experience in corporate finance and corporate/commercial matters for natural resources companies ▪ Director of Monarca Minerals ▪ CPA, 25 years as private business owner. CEO of Kerr Mines since April 2017 ▪ Owns and operates international businesses in construction and manufacturing ▪ Investments in mining
Martin Kostuik – President and Director
▪ 25 years underground and open pit mining experience. President of Kerr Mines since April 2017 ▪ CEO of Rupert Resources, Operations & Engineering at Barrick’s Goldstrike mine
Michael R. Smith – Exploration and Development
▪ 38 years exploration and geology, Chief Mine Geologist, Barrick’s Goldstrike mine. Led the Arizona Vulture Gold Mine back into
resource value alone ▪ BS Geology Arizona State and MS Geology Mackay School of Mines
David Thomas– VP Projects/Mine GM
▪ 30 years of mine building and operations experience including 5 underground gold projects with Newmont, Bema Gold (Kinross), Teck and others ▪ EPCM Manager for Newmont (worldwide) and Nordgold (Russia and Africa), EVP of Comstock Mining in Nevada 3
Ticker Symbol TSX: KER I OTC: KERMF Shares Outstanding 277.0 million Options 9.3 million Warrants1 22.2 million (exp July 2019) 21.2 million (exp Nov 2020) Fully Diluted 329.7 million 52 week range $0.105 - $0.34 Recent price $0.12 Market Cap $33.2 million Cash & Investments2 $4.0 million Sprott Resource Lending3 US$2.0 million (drawn down)
All figures denominated in Canadian dollars
1 July 2019 warrants exercisable at $0.30 and at Nov 2020 warrants exercisable at $0.21 2 Cash as at November 28, 2018 following the Private Placement 3 Sprott Resource Lending as at November 28, 2018 following the $2.7M (US$2M) convertible note. Up to $32.5M (US$25M) of
senior secured project financing, subject to further due diligence
4
Middle East Europe North America Directors & Insiders 33% Family Offices & Funds 36% Free Float 85.5M Shares or 31% Diverse Shareholder Base Tight Capital Structure
5
CALIFORNIA NEVADA
COPPERSTONE
ARIZONA Phoenix
Globally ranked in top 10 jurisdictions for Mining Arizona Detachment Fault Corridor Fully permitted, minor modifications in process Access to skilled workforce
100 km
Events Q1 Q2 Q3 Q4
Resource Expansion Drilling Detailed Engineering & Planning Permit Modifications Metallurgical Testwork Leach Plant Design/Construction Commissioning and Start-up Resource/Reserve Expansion Update Mine Development Commence Mining Commercial Production
FIRST GOLD POUR IN Q1 2020
6
7
Category Grade Contained Au M&I Resource 7.63 g/t
276,100 oz Inferred 6.81 g/t 145,700 oz P&P Reserve 6.79 g/t 175,093 oz
P&P Reserve Mine life 4.5 years**
Expansion Resource Target M&I Resource 415,000 oz Inferred 140,000 oz P&P Reserve target 320,000 oz
*Kerr Mines 2018 National Instrument 43-101 Technical Report: Preliminary Feasibility Study for the Copperstone Project, La Paz County, Arizona, USA **Mine Life based on annual production of 38,000 oz
P&P Reserve target Mine life +8 years
8
Strike Length for Measured & Indicated & Inferred 1,550m – Copperstone and Footwall Zones
Proposed workings Existing open pit Existing workings
2019 Resource Expansion program drilling area
Measured & Indicated Proven & Probable Inferred Inferred 150m = 500k oz 108m = 400k oz
D Zone C Zone B Zone A Zone
Inferred* 145,700 oz @ 6.81 g/t M&I Resource* 276,100 oz @ 7.63 g/t P&P Resource* 175,093 oz @ 6.79 g/t Resource Statement*
*Kerr Mines National Instrument 43-101 Technical Report: Preliminary Feasibility Study for the Copperstone Project, La Paz County, Arizona, USA
9
Pit Boundary
2019 Copperstone zone drilling area & holes
drilling to add M&I Resource
drilling to add Inferred for conversion later in program
knowledge and information – driving a more effective strategy
1,700m of drilling
10
*AISC is All In Sustainable Costs Kerr Mines National Instrument 43-101 Technical Report dated April 1, 2018: Preliminary Feasibility Study for the Copperstone Project, La Paz County, Arizona, USA
Excellent gold recoveries
High grade mine
High IRR
Mine expansion plans Sprott CAPEX Finance Facility
Payback in 2.3 years Cash Cost $684 oz
$0 $400 $800 $1,200 $1,600
Sustaining & all other costs: $191 oz
AISC* $875oz Operating Margin
11
Gold Price US$/oz US$1,150 / oz US$1,250 / oz US$1,350 / oz NPV5 US$ 52.6M US$ 80.4 M US$ 108.2M IRR 32.2% 45.9% 59.7% NPV5 in PFS US$ 14.2 M US$ 27.1M US$ 40.0 M IRR in PFS 24.0% 41.7% 59.9%
2019 Resource Expansion program targets 2018 PFS
the project
* NPV is calculated on a pre-tax basis
US$27.1M +US$53.3M
US$25M US$50M US$75M US$100M
US$1,250 / oz 2019 Resource Expansion program (8 year Mine Life) US$1,350 / oz Near term upside Copperstone A & B zones and the Footwall Zone NPV5 Resource Expansion program (10 year Mine Life)
US$125M US$150M 12
+US$27.8M US$108.2M +US$144.4M +US$36.2M
13
Metallurgical Test Work
consumables
by-product Permit Amendments
Powerlines Mechanical repair shop Crushing and grinding circuit Offices Tailings pond Core storage Assay lab & dry Warehouse
4km of underground access and two portals. Existing underground electrical, ventilation, water management, compressed air
Source: Michael R. Pawlowski P. Geo, January 2005 Schematic cross-section of the Moon Mountain Detachment Fault and the Copperstone Listric Fault (depth unknown), Solid heavy lines are
Copperstone Mine
Moss Mine Gold Road Mineral Park Mesquite Castle Mountain ARIZONA
NEVADA
Detachment Fault Known detachment fault- related Mineralization
Source: USGS Keith R Long Preliminary descriptive deposit model for detachment fault related model
14
Detachment Fault System
150m = 500k oz
305 L 152 L
Proposed workings Existing open pit Existing workings Measured & Indicated Proven & Probable Inferred
Historical Adit
108m = 400k oz
15
Open Open
Open
16
SOUTH WEST Target
and 53,137 oz Inferred
30,574 oz Inferred and intercepts of + 8 g/t
geophysical signature as Copperstone Zone and intercepts of 8 g/t to 32 g/t
same geophysical signature and size as Copperstone Orebody
COPPERSTONE ZONE P&P, M&I & Inferred Resource FOOTWALL ZONE Inferred Resource FOOTWALL ZONE SOUTH Extension Inferred resource BLUE PEARL Three Targets
1 2 3 4 5
17