
SLIDE 1
Inappropriate and Poorly-Regulated Land Use
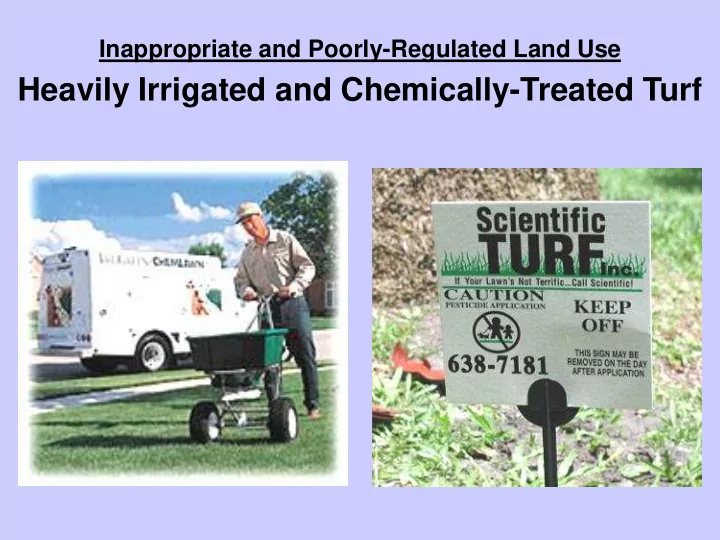
Heavily Irrigated and Chemically-Treated Turf Inappropriate and - - PowerPoint PPT Presentation
Inappropriate and Poorly-Regulated Land Use Heavily Irrigated and Chemically-Treated Turf Inappropriate and Poorly-Regulated Land Use Sewage Effluent Irrigation Sprawling Development Effects of Development on Our Water: Decreased Base Flow in
Inappropriate and Poorly-Regulated Land Use
Inappropriate and Poorly-Regulated Land Use
Effects of Development on Our Water:
Effects of Development on Our Water:
0% 10% 20% 30% 40% 50% 60% 70% 80% 90% 0% 5% 10% 15%20% 25%30% 35%40% 45% 50%55% 60%65% 70%75% 80%85% 90% Impervious Cover
Converted Baseflow Stormflow Storm flow: direct flood runoff from rainfall Base Flow: clear, clean creek flow between storm events
Source: Raymond Chan & Associates, Technical Procedures for the Watershed Erosion Assessments, September, 1997.
1 2 3 4 5 6 7 8 9 10 11 12 0.1 0.2 0.3 0.4 0.5 0.6 0.7 0.8
Impervious Cover Enlargement Ratio Alluvial Channel Rock-Bottomed Channel Rock-Controlled Channel
Effects of Development on Our Water:
Example: Curve indicates that Chemical Oxygen Demand loads at 35% IC will be 15 times higher than background loads.
the Edwards Aquifer
Engineered Controls Fail
Engineered Controls Fail
Engineered Controls Fail
Engineered Controls Fail
Engineered Controls Fail
SA ETJ SA Limits NB ETJ SM ETJ