SLIDE 1
1
ΤHE SCIENTIFIC ENERGY SAVING PROJECT OF SEMAN IN ADOCIM CIMENTO BETON, TOKAT, TURKEY
Α. ADOCIM CIMENTO BETON PLANT AT TOKAT
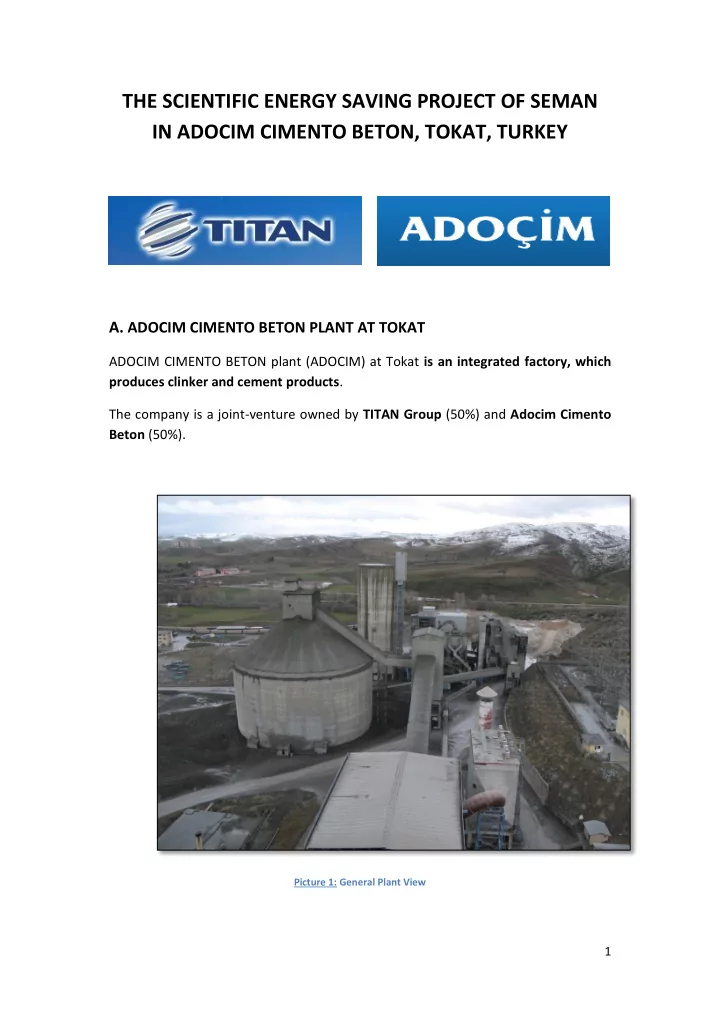
ADOCIM CIMENTO BETON plant (ADOCIM) at Tokat is an integrated factory, which produces clinker and cement products. The company is a joint-venture owned by TITAN Group (50%) and Adocim Cimento Beton (50%).
Picture 1: General Plant View
SLIDE 2
2
Picture 2: Clinker Production Line Picture 3: Furnace Tower
SLIDE 3
3
Picture 4: Storage House Picture 5: Furnace exhaust tower
SLIDE 4
4
Picture 6: Cement Silos Picture 7: The Medium Voltage (MV) Power Station of the plant (top view)
SLIDE 5 5
The total installed electric power of ADOCIM comes up to 30 MW. The grid is in 50Hz and there are 12 Transformers feeding the low voltage loads (690V, 480V), while there are also 10 medium voltage motors at 6kV. The average annual cost of electricity is 10.828.310€ in current prices.
Β. The scientific project of SEMAN for electric energy saving
The project, aiming at electric energy saving and the power quality improvement through current – voltage harmonics absorption, was concluded by SEMAN at the end of August 2013. In order to elaborate the scientific study for ADOCIM’s Electric Power Grid, the engineers’ staff of SEMAN S.A. performed measurements and recordings (Pictures 8-12) – of all the required electrical values – in each individual load of the installation (AC & DC motors, motors operating with Inverters, inductive furnaces, DC Converters, Star- Delta switches etc., both in Low and Medium Voltage). Measurements and recordings concerned the basic electric values (power, reactive power, voltage, current, frequency) as well as current & voltage harmonics (up to the 35th class) and transient phenomena. Moreover, all the essential data about the cable lengths and cross-sections, number
- f cables headed together in trays, nominal values of motors, power transformers,
single line diagrams of the substations and the plant’s electrical installation, etc., have been collected.
Picture 8: Power Quality Analyzer used for the measurements and recordings
SLIDE 6
6
Picture 9: Measurements have been performed also in the core of the electrical installation next to the loads Picture 10: Measurements with state-of-the-art power quality analyzers
The analysis of measurements and recordings showed that considerable harmonic resonance sources existed inside ADOCIM’s Electric Network, producing significant harmonic currents (in some cases total harmonic distortion for current (THD-I%) reached 45% of the fundamental, see picture 11).
SLIDE 7
7
Picture11: THD-I% in the electric network Picture 12: Portable Power Quality Analyzers connected to laptops
SEMAN’s Engineers, by using all the above theoretical and measurement-recordings data, ran a number of energy saving simulation scenarios according to SEMAN’s scientific know-how. The final scientific study concluded that 60 customized interventions (please refer to pictures 13-18) needed to be installed. All the customized interventions were installed in parallel to the electric loads, at distribution subpanels and also at motors’ junction boxes, depending on the requirements and the type of the loads. The interventions were installed even in parts of the plant with severely adverse conditions, such as dust and vibrations, taking all the necessary measures for smooth and secure operation. The total installed power of the interventions was 7,8MVA.
SLIDE 8
8
Picture 13a Picture 13b Picture 13: Three Low Voltage (LV) Variable Anti-resonance Harmonic Filters in one panel for three different electric loads (a. outer view, b. internal view)
SLIDE 9
9
It should be mentioned that for the customized interventions design, not only the interaction between all the electric loads of the network, but also the specific resonance frequencies of the electric power cables of the grid, were taken into consideration.
Picture 14: Detail of a Harmonic Reactor and a special capacitor at 690V for the LV Variable Antiresonance Harmonic Filter construction Picture 15: SEMAN’s LV Intervention (internal view)
SLIDE 10
10
Picture 16: SEMAN’s LV Intervention (internal view) Picture 17: SEMAN’s LV Intervention installed next to one of the plant’s several power distribution panels
SLIDE 11 11
Picture 18: SEMAN’s LV Intervention (internal view)
For the evaluation of SEMAN’s Power Quality Improvement & Electric Energy Saving Project result in ADOCIM CIMENT BETON, measurements and recordings were taken place during the delivery of the project (August 2013) with and without the interventions into operation. More exact, when the installation of Project's equipment was completed, the average reduction (weighted average) of the rms supply currents of the electric loads’ feeding subpanels was evaluated, through instant measurements taken before and after the start- up of the power quality improvement & saving intervention systems. The above procedure was applied for each subpanel separately & by using the results of these measurements, the mean reduction (weighted average) of the rms supply currents of the electric loads’ feeding subpanels was calculated.
SLIDE 12 12 The above measurements were also repeated in April 2014 and in August 2014. From the results of the three data set of measurements, the electric energy saving has been calculated equal to 6,1%, higher than the guaranteed 5%. Additionally, the evaluation of the electric energy saving result was realized according to the relative international bibliography (Αppendix I). Specifically, by using historical data of the electric energy consumption and operation of the several sections of the plant based on a data period before the saving project is set in operation, a mathematical model was
- developed. This mathematical model correlates with great accuracy (0% average error) the
monthly electric energy consumption of the plant with its monthly operational data (such as production data of the various departments of the plant, operational hours, etc) for the period before SEMAN’s energy saving project start-up. By applying the above mentioned Predicting Mathematical Model for the months that followed project implementation, the monthly electric energy consumptions in case that SEMAN’s project had not been implemented inside the electrical installations of ADOCIM plant was calculated. By comparing the monthly electric energy consumptions taken from the real electricity invoices of the months after SEMAN’s interventions start-up with the relevant monthly electric energy consumptions calculated by the Predicting Mathematical Model, the final electric energy and money saving results were calculated (Table 1).
Table 1. Summary Results of SEMAN’s Power Quality Improvement and Electric Energy Saving Project accomplished for ADOCIM CIMENTO BETON plant at Tokat, Turkey
Value Results Guaranteed electric energy saving according to the contract (%)
Electric energy saving finally achieved (%)
(according also to the Reference Letters by ADOCIM and TITAN)
Guaranteed Pay Back Period of the project (years) 2,2 Real Pay Back Period of the project (years) 1,8 Annual Money Saving (€) 660.527,00 €
SLIDE 13 13
- D. Conclusions according to the results of Table 1
The guaranteed electric energy saving rate of 5%, according to the contract, not only was achieved but was surpassed, reaching 6,1% in the first 10 months of project operation. Therefore, the initial energy and money saving target was indisputably achieved, leading to an even faster payback of the project cost. Moreover, beyond the main benefits of the project, other significant benefits, such as increased redundancy of the electrical installation, minimization of the problems (e.g. reduction of unwanted downtime on production lines due to improved stability of the power supply) created in the electrical installation, less wear and discharge of all electrical equipment, were observed as well, according to the Reference Letters given by TITAN & ADOCIM managers & staff of engineers. All these additional benefits of the Power Quality Improvement & Electric Energy Saving Project had the ultimate effect of reducing both the operating and maintenance costs.
SLIDE 14 14
APPENDIX I
The evaluation of the electric energy saving project result was based on the methodology described in the following International Bibliography:
- 1. Council Regulation (EEC) No 1836/93 of 29 June 1993 allowing voluntary
participation by companies in the industrial sector in a Community eco- management and audit scheme.
- 2. International Performance Measurement & Verification Protocol. Concepts and
Options for Determining Energy and Water Savings, Volume I, Revised March 2002.
- 3. North American energy M & V protocol, version 1 March 1996.